
Understanding Market Trends and Economic Indicators: A Plain-English Guide
Decoding the Market: Why Trends Matter
Have you ever looked at the stock market news and felt like you were reading a foreign language? You aren’t alone; understanding market trends can feel like trying to predict the weather in a hurricane. At its core, a market trend is simply the general direction in which a financial market is moving—whether it is bullish (upward) or bearish (downward). Identifying these shifts early is the secret weapon for savvy investors who want to protect their portfolios. When we talk about economic indicators, we are essentially looking at the ‘vital signs’ of our global financial health. Think of these indicators like a doctor checking your blood pressure or heart rate to ensure everything is functioning correctly. By learning to interpret these signals, you stop guessing and start making informed, strategic decisions about your money. We are going to strip away the jargon and break down exactly what you need to look for in this plain-English guide. Mastering these basics will empower you to navigate market volatility with significantly more confidence and clarity. Ready to dive into the indicators that actually move the needle? Let’s get started on your journey to becoming a more market-savvy individual.
The Big Three: GDP, Inflation, and Employment
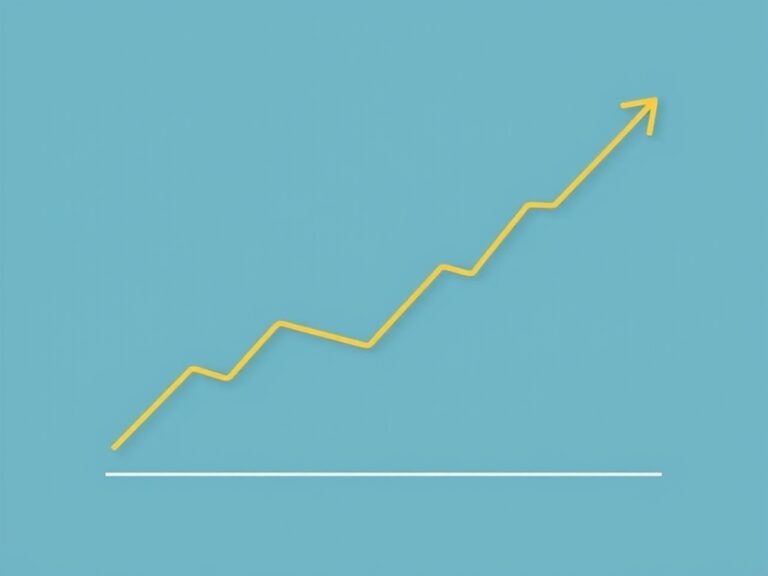
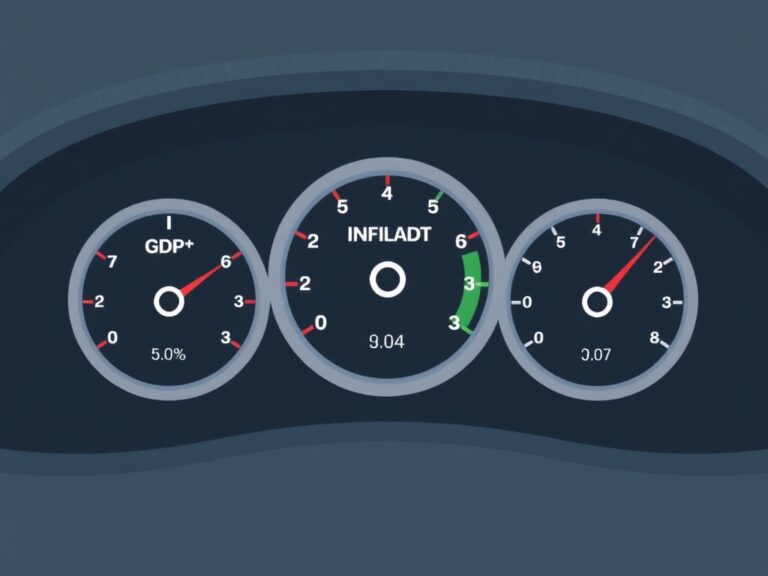
To really get a handle on the economy, you need to keep your eyes on the ‘Big Three’ economic indicators that shape every headline you read. First, we have Gross Domestic Product (GDP), which is essentially the total scorecard for a country’s economic production; when it grows, the economy is generally healthy. Second, Inflation—often measured by the Consumer Price Index (CPI)—tells you how fast the prices of your groceries and gas are rising. If inflation climbs too high, your purchasing power starts to shrink, which can lead to cautious spending habits. Third, the Employment Rate (specifically the Non-Farm Payrolls report) is arguably the most critical factor because it reflects how many people are earning wages and contributing to the economy. When people have jobs, they have money to spend, which keeps the cycle of growth moving forward smoothly. Here is what you should watch for:
- GDP Growth: Sustained increases suggest economic expansion.
- CPI Data: High numbers indicate inflation risks.
- Job Reports: Consistent job gains signal a strong labor market.
Ignoring these three metrics is like trying to drive a car without checking the dashboard; you might get somewhere, but you won’t know if you’re running out of gas. Each of these data points provides a unique piece of the puzzle that helps paint the bigger picture of where the market is heading next.
Interest Rates: The Silent Market Mover
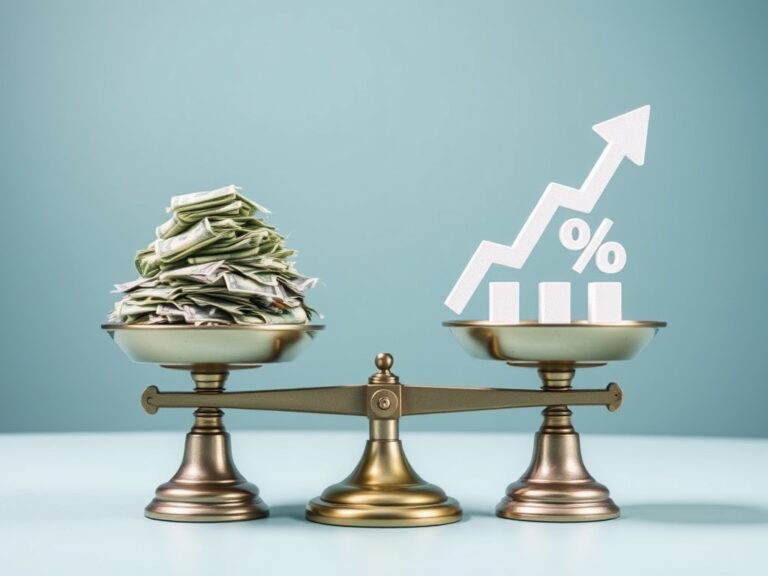
If there is one thing that keeps Wall Street up at night, it is the movement of interest rates set by central banks like the Federal Reserve. You can think of interest rates as the ‘cost of money’—when rates are low, it is cheap to borrow, which encourages businesses to expand and consumers to buy homes. Conversely, when rates rise, borrowing becomes more expensive, which acts like a brake on the economy to prevent it from overheating. Why does this matter to you? Because interest rates impact everything from your credit card APRs to the dividends on your savings accounts. When the central bank shifts rates, investors often adjust their portfolios, moving money from riskier assets like stocks into safer ones like bonds. This shift is a classic example of a market trend driven by a fundamental economic indicator.
- Low Rates: Usually fuel stock market growth.
- High Rates: Often prioritize stability and slow down inflation.
It is a delicate balancing act that central bankers perform to ensure we have long-term growth without extreme volatility. By keeping an eye on central bank announcements, you can often anticipate market reactions before they fully hit the news cycle. Understanding this relationship helps you avoid panic selling when you see temporary dips caused by policy shifts.
Putting It All Together: Your Action Plan
Now that you have a better grasp of the indicators, how do you actually apply this to your daily life? Start by building a simple routine where you check the major economic headlines once or twice a week rather than obsessing over daily swings. Remember that individual data points can be noisy; it is the long-term trend that holds the most value for your financial planning. Don’t feel pressured to act on every single piece of news; sometimes, the best investment strategy is patience and consistency in your asset allocation. If you see consistent GDP growth and a healthy job market, it might be a signal to stay the course with your growth investments. If you see inflation spiking and interest rates rising, it may be time to look for defensive strategies like bonds or high-yield savings. Always remember that market trends are meant to be understood as guides, not crystal balls that can predict the future with 100% certainty. Keep learning, keep reading, and stay curious about how these massive economic forces interact with your personal bank account. You are now equipped with the vocabulary and the framework to read financial reports with the eyes of an expert. So, go out there, keep your eyes on the trends, and make your money work harder for you. You have got this, and with practice, this will soon become second nature!