

Simplified Market Analysis: Understanding Economic Indicators in Plain English
Decoding Economic Indicators for Everyday Investors
Have you ever felt like the financial news is speaking a completely different language? You are certainly not alone, as Simplified Market Analysis often feels buried under mountains of jargon that make the economy seem like an impossible puzzle. At its core, an economic indicator is simply a piece of economic data—usually macroeconomic in scale—that analysts use to interpret current or future investment possibilities. Think of these indicators as the dashboard of a car; just as your speedometer tells you how fast you are going, indicators like GDP growth or Consumer Price Index (CPI) tell you the health of the financial engine. When you learn to read these signs, you move from guessing blindly to making informed, strategic decisions. We are going to strip away the complexity and break down how these signals work in plain English. By the end of this post, you will feel confident navigating the volatile waves of the stock market. Let’s start this journey together, focusing on clarity rather than complication.
Understanding the Heavy Hitters: GDP and Inflation
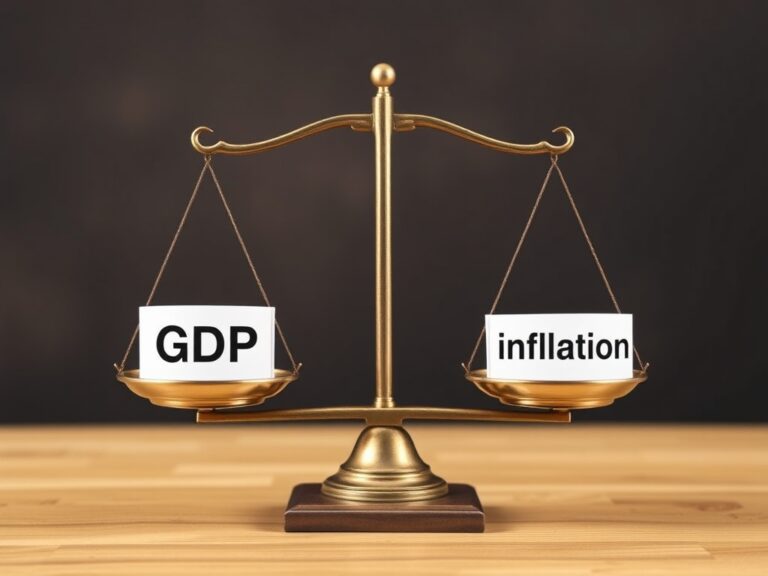
When you hear economists talk about the Gross Domestic Product (GDP), they are really just describing the total value of all goods and services produced in a country. A growing GDP is generally a green light, suggesting that businesses are expanding and people are spending money, which often signals a healthy market climate. However, you must pair this with an understanding of inflation, which tracks the rate at which the general level of prices for goods is rising. High inflation is the ‘hidden tax’ that can erode your purchasing power if your investments aren’t outperforming that growth. Consider these two factors as the push-and-pull mechanism of the economy:
- GDP: The engine pushing growth forward.
- Inflation: The friction that can slow down your real-world returns.
Monitoring these indicators allows you to gauge whether the economy is ‘overheating’ or if it has room to expand. If inflation climbs too fast, central banks often step in by raising interest rates to cool things down. This delicate balancing act is something every smart investor should watch closely to adjust their portfolio strategy accordingly.
The Human Element: Labor Market Data
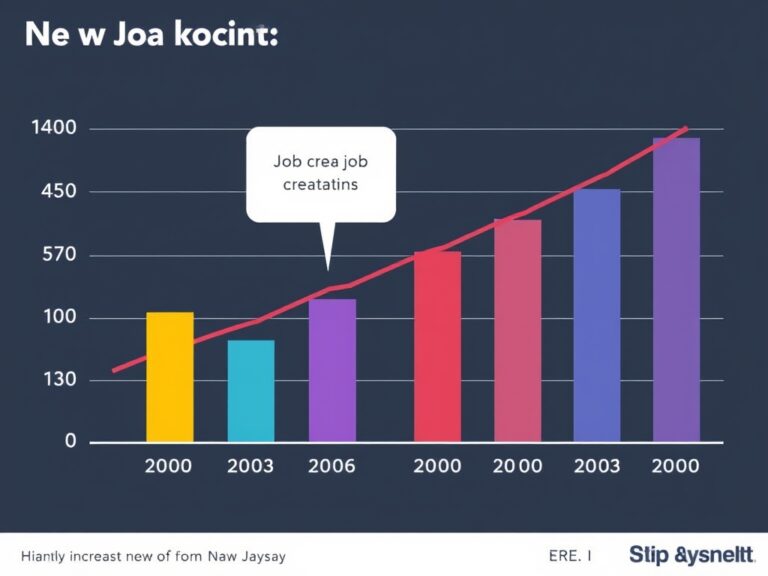
You might wonder why everyone gets so excited about the monthly Non-Farm Payrolls report, but the answer is quite simple: people power the economy. When the labor market is strong, businesses are hiring, unemployment is low, and consumers have the disposable income to keep the gears of commerce turning. This is a massive indicator of long-term economic stability because, without consumer confidence and job security, spending tends to plummet. Low unemployment rates typically lead to higher wages, which can stimulate further growth but also put upward pressure on prices. It is a cycle of cause and effect that defines our daily financial reality. Pay attention to trends in:
- Job Openings: Reflecting corporate optimism.
- Wage Growth: Indicating the strength of the consumer.
- Unemployment Claims: Serving as a leading indicator of economic stress.
When jobs are plentiful, the market generally reacts with optimism, but when the numbers miss expectations, you might see some short-term volatility. Always remember that a robust labor market is the foundation upon which strong stock market performance is built.
Putting It All Together: Your Strategic Advantage
Now that we have covered the basics, how do you actually apply this Simplified Market Analysis to your personal investments? It is not about timing the market to the exact second, but rather understanding the environment in which your money is growing. You can use these insights to diversify your assets; for example, shifting towards defensive stocks when indicators suggest an economic slowdown is on the horizon. Don’t let the data intimidate you; instead, view it as a tool that grants you financial literacy and autonomy. Stay curious, keep reading, and remember that consistent, informed habits will always beat speculative betting. You now possess the keys to interpret the news cycle like a seasoned pro rather than a nervous spectator. Remember these core takeaways:
- Check the latest GDP reports for growth trends.
- Watch inflation to protect your long-term wealth.
- Follow labor data to gauge consumer health.
By keeping these indicators on your radar, you can filter out the ‘noise’ and focus on the signals that actually matter. Start small, track a few metrics each month, and watch how your perspective on the financial world transforms into something much more manageable and exciting.