Market Movements and Economic Indicators Explained in Plain English
Have you ever looked at a financial news channel and felt instantly overwhelmed by the flashing red and green numbers scrolling across the screen? You are certainly not alone, as the world of market movements can often feel like it is written in a completely foreign language. However, at its very core, the stock market is simply a giant, global marketplace where people buy and sell pieces of companies. The movement of these stock prices is driven primarily by the basic economic principle of supply and demand, mixed with a heavy dose of investor sentiment. When more people want to buy a stock (demand) than sell it (supply), the price goes up; conversely, when selling pressure outweighs buying interest, prices fall. To help you navigate this complex landscape, we can break down these dynamics into key areas: market trends, investor sentiment, and market volatility.
- Market Trends represent the broad directions in which the market moves over time, commonly classified as bull (rising) or bear (falling) markets.
- Investor Sentiment refers to the collective psychological attitude of traders, which often swings dramatically between fear and greed.
- Market Volatility indicates the speed and size of price fluctuations, signaling the level of uncertainty in the market.
By understanding that markets are driven by human decisions and collective behavior, you can begin to look past the daily noise and focus on the bigger picture. Ultimately, successful long-term investing relies on understanding these underlying forces rather than reacting to every single tick of the ticker tape. Armed with this foundational knowledge, you will feel much more confident analyzing how the economy influences these daily market swings.

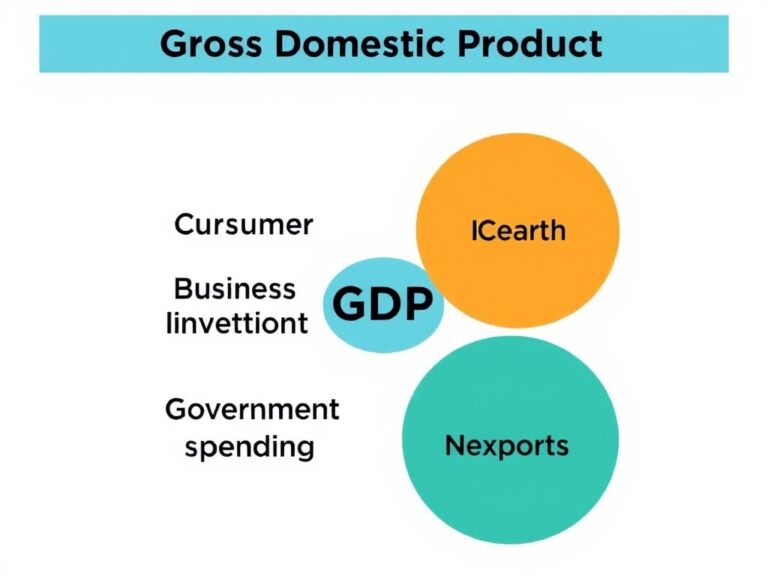
To truly understand why the markets move, we must look at the report cards of the economy, known as economic indicators, starting with Gross Domestic Product (GDP). In plain English, GDP is the total dollar value of all goods and services produced within a country’s borders over a specific period, usually a quarter or a year. Think of it as a giant thermometer measuring the overall temperature and health of the entire nation’s economy. When the GDP is growing at a healthy pace, it indicates that businesses are making money, people are working, and consumer spending is robust. Conversely, if GDP shrinks for two consecutive quarters, it officially signals a technical recession, which often sends shockwaves through the financial markets. For investors, monitoring GDP is crucial because a growing economy typically translates to higher corporate earnings and rising stock prices. Let’s look at the primary components that make up this vital economic health indicator:
- Consumer Spending: This is the engine of GDP, representing everything you and I buy, from groceries to new cars.
- Business Investment: The money spent by companies on equipment, factories, and research to fuel future growth.
- Government Spending: Infrastructure projects, defense spending, and public services funded by tax revenues.
- Net Exports: The total value of a nation’s exports minus its imports, showing trade balance health.
When these components are firing on all cylinders, the stock market generally thrives as optimism spreads. However, if any of these gears start to slip, smart investors begin adjusting their portfolios to prepare for slower growth ahead.
Next up on our economic journey is an indicator that directly impacts your wallet every single day: inflation and the Consumer Price Index (CPI). Inflation is the gradual rate at which the general level of prices for goods and services rises, causing your purchasing power to slowly erode. To track this, economists rely heavily on the Consumer Price Index (CPI), which measures the average change over time in the prices paid by urban consumers for a market basket of consumer goods and services. When CPI rises too quickly, it indicates that inflation is heating up, which means your hard-earned dollars won’t buy as much tomorrow as they do today. Central banks keep an incredibly close eye on CPI because high inflation can completely derail economic growth if left unchecked. When inflation spikes, the stock market often reacts negatively due to fears of rising costs and lower corporate profit margins. To adapt to these inflationary environments, investors must pay close attention to several critical factors:
- Purchasing Power: The real value of money in terms of what it can buy, which decreases as inflation climbs.
- Core CPI: A variation of the CPI that excludes volatile food and energy prices to show long-term underlying trends.
- Wage Growth: Whether worker paychecks are keeping pace with rising prices to sustain consumer spending.
A moderate level of inflation (around 2% annually) is actually considered healthy and normal for a growing economy. However, when inflation starts sprinting rather than walking, it forces policy makers to step in and cool things down, disrupting market trends.

Another incredibly powerful driver of market movements is the health of the labor market, typically analyzed through the monthly jobs report and the unemployment rate. In plain English, the unemployment rate represents the percentage of the labor force that is actively looking for work but cannot find a job. A low unemployment rate is generally a fantastic sign for the economy because it means more people have paychecks to spend on products and services. This consumer spending, in turn, drives corporate revenues and encourages businesses to expand, creating a positive feedback loop for the stock market. However, a labor market that is too tight can actually lead to wage inflation, where companies must raise salaries to attract limited talent, raising overall costs. The financial markets watch the monthly employment data release with absolute intensity, as it heavily influences future interest rate decisions. To better interpret these labor dynamics, it is helpful to look at the key elements of the monthly jobs report:
- Nonfarm Payrolls: The total number of paid workers in the nation, excluding farm workers, government employees, and non-profit workers.
- Unemployment Rate: The headline percentage of jobless individuals within the active workforce.
- Average Hourly Earnings: An indicator of wage inflation, showing how much workers’ wages are changing over time.
When job growth is steady and strong, it acts as a robust foundation for sustainable, long-term economic expansion. Conversely, a sudden spike in unemployment can trigger defensive moves in the stock market, as investors brace for reduced consumer activity.
Finally, we must examine the ultimate puppet masters of the financial markets: central banks and their primary tool, interest rates. In the United States, the Federal Reserve (often called ‘the Fed’) acts as the central bank, managing monetary policy to promote maximum employment and stable prices. When the economy is growing too quickly and inflation is rising, the Fed will raise interest rates to deliberately cool down economic activity. Higher interest rates make borrowing money more expensive for both consumers buying homes and businesses seeking to fund expansion projects. Conversely, when the economy is struggling or entering a recession, the Fed will slash interest rates to make borrowing cheap and encourage spending. This delicate balancing act has a profound, direct impact on stock market valuations and overall investment strategies. To understand how these interest rate decisions flow through the financial system, consider these core mechanics:
- Borrowing Costs: The price paid to use someone else’s money, which directly affects corporate profit margins and consumer auto/home loans.
- Yield Curves: Visual representations of the relationship between short-term and long-term interest rates on government bonds, often signaling recessions.
- Asset Allocation: The strategy of distributing investment funds among different asset classes, like stocks and bonds, based on interest rate trends.
When interest rates are low, stocks tend to perform exceptionally well as investors search for better returns than what savings accounts offer. By keeping a close eye on central bank policies, you can better position your investment portfolio to weather whatever economic season lies ahead.