

Market Trends Simplified: Understanding Economic Indicators in Plain English
Decoding the Economic Maze: Why Market Trends Matter
Have you ever glanced at the financial news and felt like you were reading a foreign language? You aren’t alone, as economic indicators are often buried in dense jargon that makes them feel inaccessible to the average investor. Understanding these trends is essentially like reading the weather report for your money; when you know if a storm is brewing, you can prepare accordingly. By grasping fundamental concepts like inflation, GDP, and employment rates, you stop guessing and start making informed decisions. Think of this as your personal map to navigating the complex landscape of global markets. We are going to strip away the technical fluff and focus on what actually impacts your wallet in everyday terms. Whether you are saving for a home or managing a retirement fund, these indicators serve as the pulse of the economy. Let’s break down these pillars of finance so you can stop worrying and start understanding how your assets move. We’ll keep things simple, actionable, and straight to the point. Ready to become an economic expert in your own right? Let’s dive in and clear the fog once and for all.
The Big Three: GDP, Inflation, and Employment
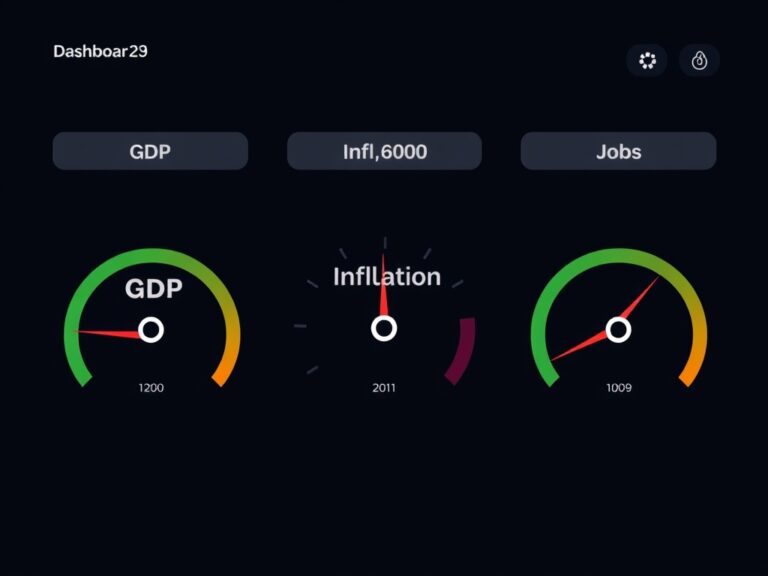
If you only pay attention to three things, make sure they are the ‘Big Three’ that drive nearly every major financial decision on Wall Street. First, we have GDP (Gross Domestic Product), which is simply the scorecard for how much stuff a country produces and consumes. When GDP is up, businesses are thriving, and the economy is generally in a healthy growth phase. Second, keep a close eye on Inflation, which measures how much your money loses its purchasing power over time. It’s the silent tax that determines if your grocery bill goes up or down next month. Finally, Employment Rates act as the heartbeat of consumer confidence; when people have jobs, they spend, which fuels the entire cycle. Here is a quick look at why these matter:
- GDP: Reflects total economic output and growth.
- Inflation: Tells you how fast prices are rising.
- Unemployment: Gauges how many people are contributing to the economy.
These factors interact like a complex machine where one gear turns the other. Understanding their relationship helps you anticipate market shifts before they dominate the evening news. Don’t worry about memorizing formulas, just focus on the direction these numbers are heading. When these three work in harmony, you usually see a stable environment for long-term investments. Keep these three metrics on your radar, and you’ll instantly be ahead of the curve.
Connecting the Dots: How Indicators Impact Your Investments
Now that you know what the indicators are, how do they actually change your investment strategy? It’s all about risk appetite and shifting your portfolio to match the current ‘economic weather’ outside. For instance, in an environment of high inflation, savvy investors often look toward assets that historically hold value, like real estate or commodities. When employment numbers remain strong, the stock market often thrives because businesses have more customers with disposable income. On the other hand, a dip in GDP usually signals a time to be more defensive and cautious with high-risk stocks. Consider the following simple tactics for navigating these cycles:
- Growth Phases: Focus on equities and expanding your portfolio.
- High Inflation: Look into inflation-protected securities or physical assets.
- Uncertainty: Maintain a cash buffer to weather potential market volatility.
You don’t have to be a professional day trader to use this data; you just need to align your long-term goals with the macro reality. Most people make the mistake of reacting emotionally to daily headlines rather than looking at the core indicators. By staying logical and objective, you take the ‘panic’ out of your financial planning. Remember, your investment strategy should be like a sturdy boat that can handle both calm waters and minor storms. Use these insights to check your sails, not to change your destination entirely.

Staying Informed: Your Action Plan for Future Success
You might be wondering, ‘Do I need to check these numbers every single morning?’ The answer is a resounding no, because consistency is far more important than intensity when it comes to economic literacy. Instead of stressing over daily changes, try checking major economic reports on a monthly or quarterly basis. You can use free resources like the Bureau of Labor Statistics or reliable financial news outlets to get the data you need without the noise. Focus on long-term trends rather than the knee-jerk reaction of the stock market on any given Tuesday. The goal is to build a foundation of knowledge that empowers you to ask better questions and make smarter choices. Over time, these small bits of insight will compound into a massive advantage for your financial well-being. Share this guide with a friend who is also trying to make sense of the market, as learning together is always better. Feel empowered knowing that you no longer have to fear the jargon-filled headlines. You are now equipped with the vocabulary and the logic to understand the driving forces of our global economy. Keep learning, keep observing, and keep growing your financial confidence every single day. The market is just a series of stories; now you know how to read them.