
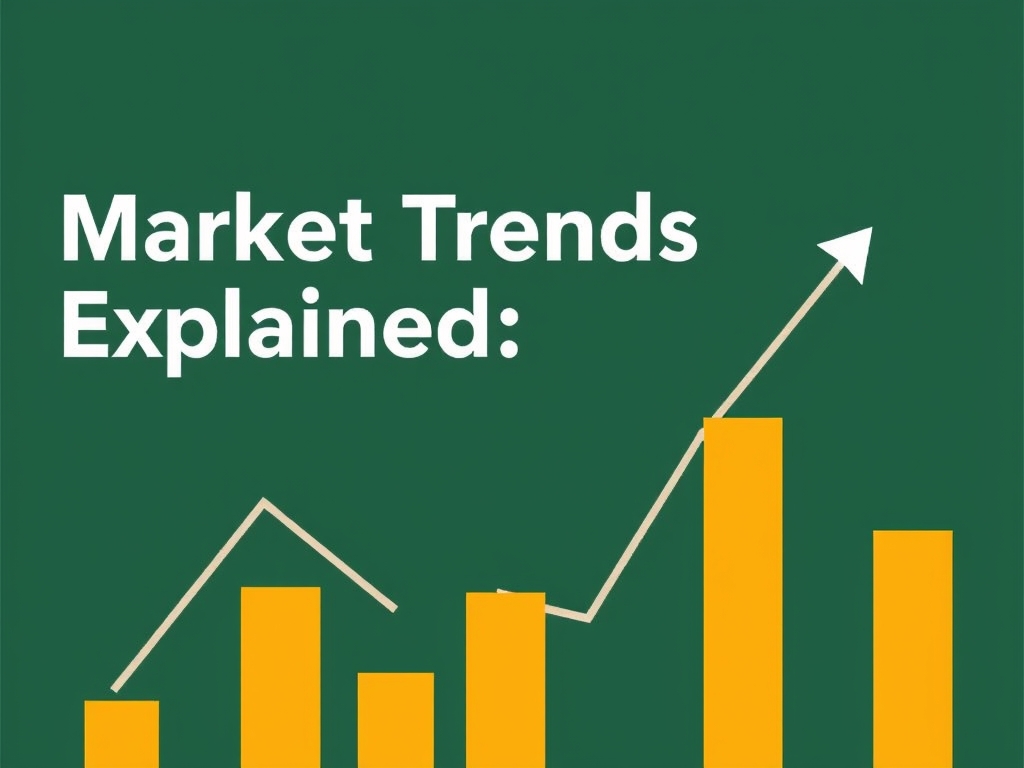
Market Trends Explained: A Plain-English Guide to Economic Indicators and Price Movements
Understanding the Pulse of the Market
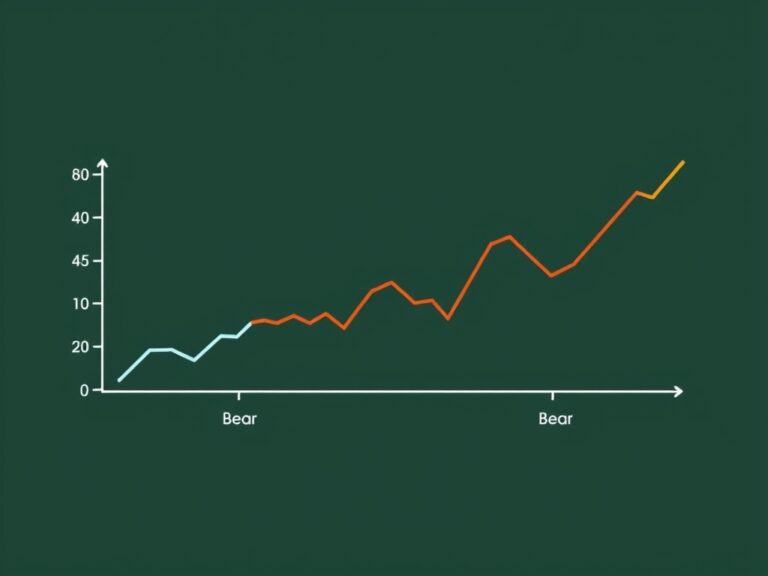
Have you ever wondered why the stock market seems to move like a roller coaster while your local grocery prices fluctuate without warning? Market trends are essentially the collective heartbeat of the global economy, and understanding them is your first step toward financial literacy. At its core, a market trend is simply the general direction in which a financial asset or the overall market is moving over time. Whether it is a bull market, where optimism drives prices up, or a bear market, which reflects pessimism and falling prices, these movements are rarely random. They are driven by a complex interplay of human psychology, geopolitical events, and fundamental economic data. By learning to read these signals, you shift from being a spectator to an informed participant in your financial future. Think of it like reading the weather map before deciding whether to go for a hike; it doesn’t guarantee the path will be easy, but it helps you prepare for the terrain ahead. Throughout this guide, we will break down the essential indicators that professional traders and smart investors use to gauge economic health. Let’s peel back the layers of the financial world together in plain English.
The Big Three: Key Economic Indicators
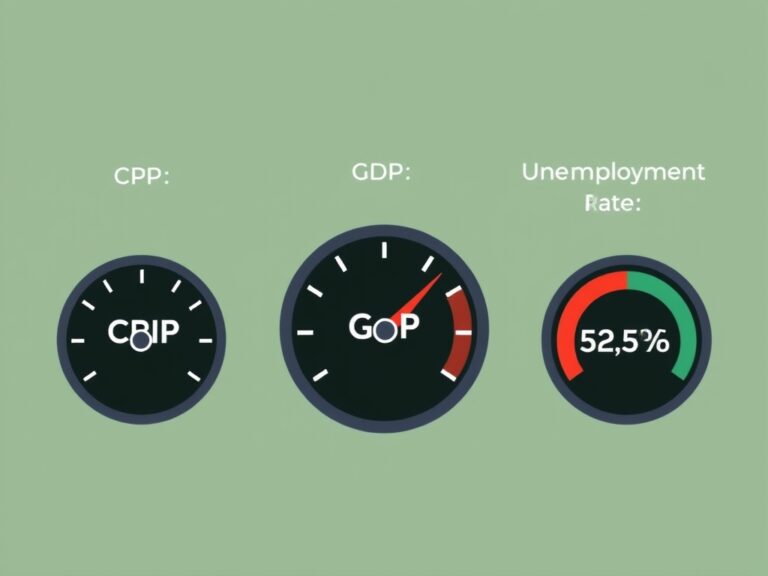
When experts talk about the ‘state of the economy,’ they are almost always looking at a specific set of economic indicators that act as a dashboard for national performance. First, we have the Consumer Price Index (CPI), which measures the average change over time in the prices paid by urban consumers for a market basket of goods and services. If the CPI is rising, we are looking at inflation, which can erode your purchasing power if your income doesn’t keep pace. Second, the Gross Domestic Product (GDP) serves as the ultimate scorecard, representing the total value of goods and services produced within a country’s borders. Third, we track the unemployment rate, which tells us how many people are looking for work but can’t find it, signaling the strength or weakness of the labor market. These metrics provide a snapshot of growth, stability, and future potential. By monitoring these, you can anticipate how central banks might react with interest rate changes. It is a domino effect where one indicator often influences the others in a predictable pattern. Learning to track these will give you a significant edge in spotting long-term trends before they become mainstream news.
Decoding Price Movements and Volatility
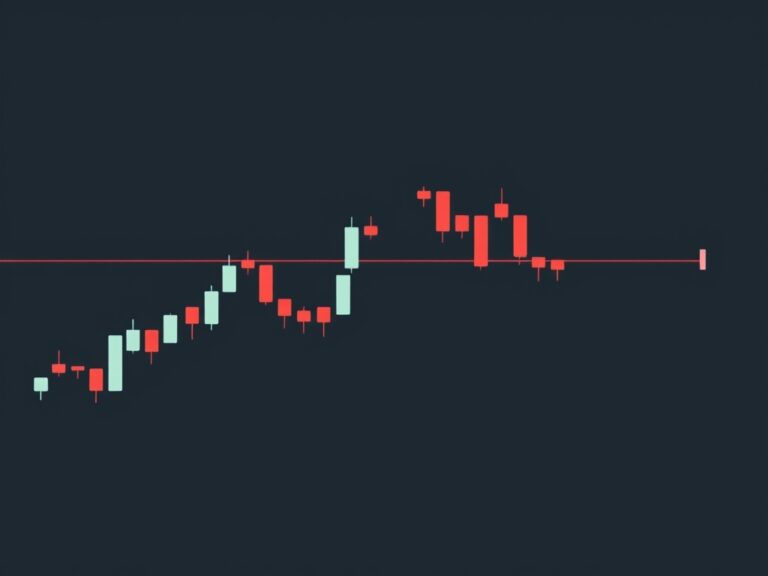
Price movements are the visible result of supply and demand interacting in real-time, often influenced by the economic indicators we just discussed. When demand outstrips supply, prices tend to climb, creating an upward trend, whereas an oversupply leads to price drops. However, it isn’t always that simple because market sentiment often overrides logic in the short term. You might notice
- Sudden price spikes due to unexpected earnings reports
- Gradual shifts caused by changing interest rates
- Short-term volatility driven by geopolitical uncertainty
. Understanding volatility is crucial because it measures how drastically prices move over a period; high volatility means bigger risks but potentially bigger rewards. Technical analysis allows investors to look at historical price charts to identify patterns that might repeat. Even if you aren’t a day trader, knowing how these price cycles work helps you avoid panic-selling during a dip. Remember, the market is a discounting machine that tries to price in future expectations today. Therefore, seeing a price drop might actually be the market reacting to news that hasn’t even fully hit the headlines yet. Stay calm, keep a long-term perspective, and focus on the underlying fundamentals rather than the daily noise.
How to Stay Ahead of the Curve
Navigating the complex world of finance doesn’t require a PhD in economics, but it does require consistent habits and a healthy dose of curiosity. To stay informed, you should make it a priority to follow reputable financial news sources and watch how major indices like the S&P 500 react to government announcements. Diversification remains the best tool in your kit for handling the unpredictable nature of market trends. By spreading your investments across different sectors and asset classes, you naturally cushion yourself against the volatility inherent in specific industries. Always ask yourself: Is this news noise, or does it shift the fundamental economic outlook? Keep a journal of your observations; noting what you think will happen versus what actually happens is a powerful way to refine your intuition. As you become more comfortable with these terms, you will find that the ‘scary’ headlines carry less weight. The goal is not to predict the exact top or bottom of a market movement, which is impossible anyway. Instead, the goal is to align your strategy with the broader economic reality. With patience and a commitment to continuous learning, you will find that navigating the financial markets becomes much more manageable and significantly less intimidating.