
Market Trends Explained: A Plain-English Guide to Economic Indicators and Movements
Understanding the Pulse of the Global Economy
Have you ever wondered why the news gets so excited about market trends? Think of the economy as a living, breathing entity, and economic indicators are the vitals that tell us how it’s feeling today. When we talk about market movements, we are essentially looking at the collective behavior of investors, businesses, and consumers worldwide. Navigating these fluctuations might feel like trying to solve a complex puzzle, but it all boils down to a few key signals that move the needle. Why does this matter to you? Because understanding these shifts helps you make smarter decisions with your savings and investments. Whether it is a bull market signaling optimism or a bear market warning of caution, these patterns are predictable if you know what to look for. In this guide, we will break down the complex jargon into plain English so you can feel confident in your financial literacy journey. Let’s dive into the fascinating world of macroeconomics and demystify how these indicators shape your wallet. You will learn to spot the red flags and the green lights that dictate where capital flows. By the end of this post, you’ll be reading market reports like a seasoned pro. Stick with me, and we will simplify the noise together.

Key Indicators That Drive Market Behavior
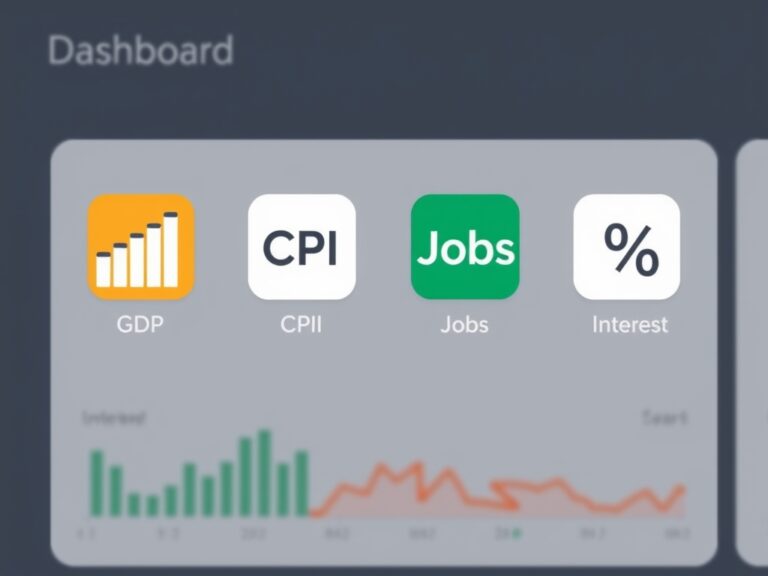
When analysts talk about market movements, they often point to a few heavy-hitting economic indicators that act as catalysts. First, we have Gross Domestic Product (GDP), which is the total value of all goods and services produced in a country. A growing GDP is generally a sign of a healthy economy, but rapid growth can sometimes lead to overheating and inflation. Next, we look at the Consumer Price Index (CPI), which is the gold standard for measuring inflation and how much your daily cup of coffee is costing you compared to last year. Employment figures, specifically the non-farm payroll report, provide insight into how many businesses are hiring and the overall strength of the labor market. Central bank policies, especially interest rate decisions by the Federal Reserve, act as the thermostat for the entire financial system. When rates go up, borrowing becomes expensive, which usually cools down market excitement. Conversely, lower rates encourage spending and investment, which often boosts stock prices significantly.
- GDP: The measure of national productivity.
- CPI: The gauge for inflation and purchasing power.
- Employment Data: The pulse of the workforce.
- Interest Rates: The cost of borrowing money.
Understanding these four pillars is essential for any investor or curious reader.
Decoding Bull and Bear Market Cycles
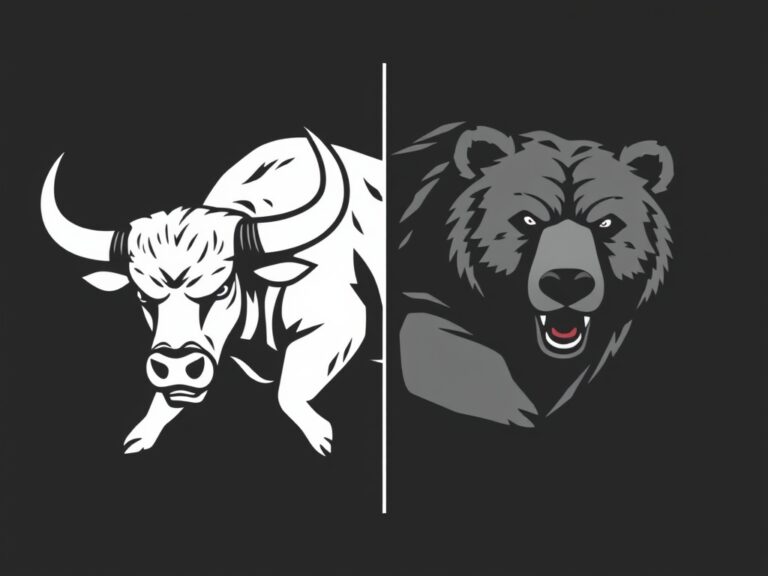
We often hear the terms Bull Market and Bear Market thrown around in every financial news headline. Simply put, a bull market is when prices are rising or are expected to rise, creating an atmosphere of widespread investor confidence. Bull markets are driven by optimism and a strong economy, often characterized by high employment and corporate earnings growth. On the other hand, a Bear Market is defined by a decline in prices, usually marked by a drop of 20% or more from recent highs. These periods can feel scary, but they are a natural part of the economic cycle that clears out inefficiencies in the market. It is important to remember that markets are cyclical; what goes up must eventually cool down, and what goes down eventually finds a floor. Smart investors use these cycles to their advantage rather than panicking when the charts turn red. Diversification becomes your best friend during these times, acting as a shield against extreme volatility. Think of it as riding a roller coaster—the dips are inevitable, but the ride continues moving forward over the long haul. By staying informed, you can avoid emotional decision-making and stay focused on your long-term goals.
Putting It All Together: Your Financial Strategy
Now that we have covered the basics, how do you actually apply this knowledge to your life? Knowledge is power, but implementation is the key to achieving real financial security. You do not need to be a Wall Street tycoon to succeed; you just need to be a consistent and informed participant in the market. Start by setting aside time to read the latest economic outlook reports and follow reliable news sources that provide data without the sensationalism. Focus on long-term trends rather than daily price fluctuations, which are often just background noise created by short-term traders. Consistency is your greatest advantage, so consider using strategies like dollar-cost averaging to mitigate the impact of market volatility. Remember that your financial plan should always be tailored to your personal goals and risk tolerance, not just the current market trend. If you ever feel overwhelmed, consult with a financial advisor who can help translate these signals into a personalized strategy. Stay curious, keep learning, and don’t be afraid to ask questions about how the economy works. With a bit of practice, you will find that these complex movements become second nature to you. Keep your eyes on the horizon, keep your portfolio diversified, and most importantly, stay calm when the market gets busy.