

Market Analysis Made Simple: Understanding Economic Indicators and Trends
Decoding the Market: Your Journey Begins Here
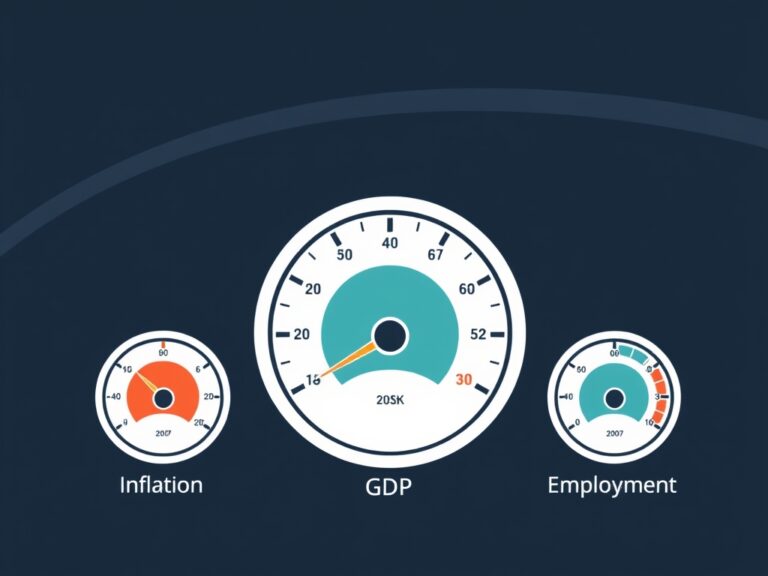
Have you ever wondered why the stock market zigs when it should zag, or why your grocery bill seems to fluctuate with the seasons? Market analysis isn’t just for Wall Street sharks; it is a vital skill for anyone looking to understand the pulse of the economy. By learning to interpret economic indicators, you move from being a passive observer to an informed participant. Think of these indicators as the dashboard of a high-performance car, telling you exactly how fast the engine is running and if you need to watch for trouble ahead. When we simplify market analysis, we realize it is just about spotting patterns in data that represent real human behavior. In this guide, we will break down the complex jargon into bite-sized, actionable insights. Understanding trends helps you make smarter decisions, whether you are investing your hard-earned money or planning a career move. Let’s demystify these trends together with a conversational approach that skips the headache-inducing fluff. By the end of this post, you will feel significantly more confident navigating the financial landscape.
The Big Three: Essential Economic Indicators You Must Know
To get a clear picture of the economic climate, you need to track a few key Key Performance Indicators (KPIs) that signal health or distress.
- GDP (Gross Domestic Product): The total market value of goods produced, acting as the ultimate heartbeat of a nation.
- Inflation (CPI): The rate at which the cost of living increases, showing you how far your dollar stretches today compared to yesterday.
- Unemployment Rate: A critical look at how many people are active in the workforce, which directly impacts consumer spending power.
These indicators act as a compass for investors and entrepreneurs alike. When GDP growth is strong, it often suggests a healthy, expanding economy where businesses thrive. Conversely, if inflation spikes too high, it might signal that the central bank will raise interest rates to cool things down. Watching these numbers prevents you from making emotional decisions based on media headlines. Instead, you get to rely on concrete, historical, and real-time data to form your own perspective. It is about connecting the dots between these indicators and your own financial reality for better long-term stability.
Spotting Trends: Riding the Wave vs. Getting Swept Away
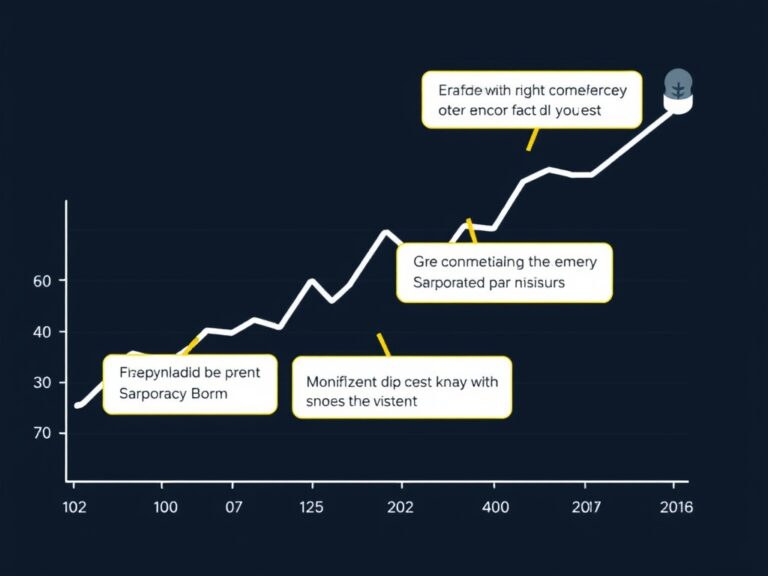
Every market moves in cycles, and identifying trends is the secret sauce for longevity in any financial endeavor. Whether you are looking at secular trends that last for decades or cyclical trends that mirror the seasons, the key is pattern recognition. You should always look for the ‘Why’ behind the movement—is it technological innovation, policy change, or a shift in consumer sentiment? By using simple technical analysis tools or simply following industry reports, you can get ahead of the curve. Consider these factors:
- Technological Adoption: Fast-growing tech sectors often define new market cycles.
- Consumer Behavior: What are people spending their money on right now?
- Global Supply Chains: Disruptions here can create ripple effects across every sector.
Instead of fighting the current, smart analysts look for ways to position themselves to benefit from the shifting tide. Being proactive rather than reactive is the difference between surviving a downturn and flourishing through it. Remember, trends don’t move in a straight line, so maintain a flexible mindset and stay updated on the latest financial news. Consistency in tracking these indicators will turn your intuition into a professional-grade strategy.
Taking Action: Putting Your Knowledge to Work
Now that you have a better grasp of the indicators, it is time to turn that knowledge into a financial strategy that works for you. Start by setting aside ten minutes each week to review a summary of these indicators from reputable sources like the Bureau of Labor Statistics or major financial news outlets. Do not feel overwhelmed; you do not need to track every single data point to make progress. Focus on the ones that impact your specific interests or investment goals the most. Consistency is your greatest asset in mastering market analysis, as small, regular steps will yield the best results over time. If you find yourself confused, look for simplified summaries or even visual YouTube explainers that break down the monthly reports. Market analysis is essentially a lifelong hobby that pays dividends in both knowledge and capital. As you become more comfortable, you might even start noticing how current events immediately impact your local economy. Finally, share what you learn with others, as teaching is often the best way to solidify your own understanding. You have the tools, the interest, and the drive—go out there and master the markets with confidence!