
Market Analysis Explained: A Plain-English Guide to Economic Indicators and Trends
Understanding the Pulse of the Global Economy
Have you ever wondered why stock markets swing wildly one day and remain perfectly calm the next? At its core, market analysis is simply the art of decoding the economic signals that drive these movements, acting like a weather forecast for your portfolio. By paying attention to economic indicators, you can stop guessing and start making informed decisions based on real-time data. Think of the economy as a giant, interconnected machine where every piece of data—from job reports to retail sales—is a gear working in tandem to determine our collective financial future. Understanding these shifts doesn’t require a PhD in economics, but it does require a bit of curiosity and the right perspective. In this guide, we will break down the most essential indicators that every investor, entrepreneur, or curious mind should keep on their radar. We’ll explore why these metrics matter and how they impact your everyday life and investments. By learning to read the ‘financial heartbeat,’ you can navigate market volatility with significantly more confidence. Let’s peel back the layers and make these complex concepts accessible for everyone. Welcome to your simplified roadmap for mastering economic trends.
The Big Three: GDP, Inflation, and Unemployment
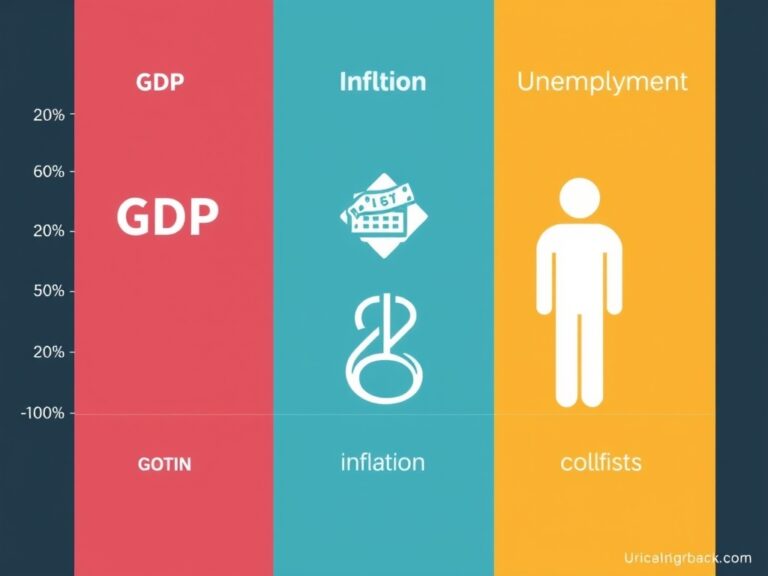
When you start digging into market analysis, you will inevitably run into the ‘Big Three’ economic indicators: Gross Domestic Product (GDP), Inflation (CPI), and Unemployment rates. These metrics represent the primary vital signs of a nation’s economic health and are watched by everyone from Wall Street analysts to central bankers.
- GDP: Measures the total value of goods and services; think of it as the economy’s total output.
- Inflation: Tracks the rising cost of living; it tells us how much our purchasing power is shifting over time.
- Unemployment: Reflects the percentage of people looking for work, which is a major signal of consumer confidence.
When GDP is rising, it often suggests a healthy, expanding business climate, but if it grows too fast, it might trigger inflation. Conversely, high unemployment can lead to lower consumer spending, which pulls the entire economy into a sluggish state. Understanding how these three interact is essentially like learning the physics of the financial world. By monitoring these figures, you can spot when an economy is reaching its peak or heading toward a potential downturn. Remember, these numbers are released periodically, providing us with regular snapshots to update our outlook. Keeping a pulse on these three areas is the foundation of any solid investment strategy.
Why Sentiment and Leading Indicators Matter
While the ‘Big Three’ give us a status report on where we are, leading indicators help us peek into the future to see where we might be heading. These include things like consumer confidence surveys, building permits, and even the performance of the stock market itself. Market sentiment, or the prevailing attitude of investors, plays a massive role in how these indicators translate into price action. If everyone is optimistic, companies hire more, consumers spend more, and the cycle of growth continues. However, if fear takes hold, even good news can be ignored as people brace for a potential recession.
- Consumer Confidence: A barometer of how likely people are to spend money in the coming months.
- Building Permits: A classic signal of future economic construction and development.
- Stock Market Trends: Often considered a leading indicator because it discounts future expectations before the actual economic data drops.
By keeping an eye on these sentiment-driven indicators, you can better anticipate market pivots before they become mainstream headlines. It is not about predicting the exact future, but about identifying the most likely scenarios based on current behavior. Mastering these allows you to stay ahead of the curve rather than reacting to the news after the fact. It turns you from a passive observer into an active, insightful participant in the financial world.

Putting It All Together: Your Action Plan
Now that we have decoded the essentials, you might be asking yourself how to put this all into practice without getting overwhelmed by data. The secret is to maintain a balanced perspective and focus on the trends that align with your specific financial goals. You do not need to check every single spreadsheet daily; instead, look for the macro-trends that shift over weeks and months rather than minutes. Start by following reputable sources that summarize these indicators into plain English so you can spend less time processing raw data and more time applying it. Stay curious about how international events, like supply chain shifts or global policy changes, impact your local economic environment. Remember that volatility is a natural part of the cycle, and understanding the ‘why’ behind the ‘what’ is your best defense against impulsive decision-making.
- Identify your time horizon—are you a long-term investor or a short-term trader?
- Focus on high-impact reports like the Non-Farm Payroll or CPI data releases.
- Always look for the connection between the economy and your own industry or personal assets.
With this foundation, you are well-equipped to interpret the noise of the market and focus on the signals that actually move the needle. Keep learning, stay patient, and use these tools to build your financial future with clarity and precision. Happy analyzing!