

Making Sense of the Markets: A Plain-English Guide to Economic Indicators and Trends
Understanding the Pulse of the Global Economy
Have you ever watched the news and felt like market analysts are speaking a completely different language? You aren’t alone; the world of economic indicators can feel like a labyrinth of complex charts and jargon, but it is actually the roadmap to understanding how your money works. Economic indicators are essentially the vital signs of our financial health, telling us whether the economy is running a marathon or struggling to get off the couch. By keeping an eye on these metrics, you can transform from a passive observer into an informed investor who makes decisions based on data-driven trends rather than gut feelings. Think of these indicators as a dashboard for a car—without them, you are driving blind through a dense fog. In this guide, we will break down the most influential signals, from the labor market to inflation, ensuring you have the knowledge to navigate market volatility with confidence. Mastering these basics is the first step toward achieving long-term financial literacy and peace of mind. Let’s strip away the confusion and dive into what truly moves the needle in the financial world today.
The Big Three: GDP, Inflation, and Unemployment
To really get a grip on the market, we need to focus on the ‘Big Three’ indicators that every investor watches like a hawk.
- GDP (Gross Domestic Product): This measures the total value of goods and services produced, acting as the ultimate scorecard for economic growth.
- Inflation (CPI): Think of this as the ‘hidden tax’ that erodes your purchasing power over time if left unchecked.
- Unemployment Rate: This is a direct measure of consumer confidence and the overall vitality of the labor market.
When GDP is rising, businesses are generally expanding and hiring, which creates a positive cycle of spending and investment. However, if inflation climbs too high, central banks often step in with interest rate hikes to cool things down, which can feel like a cold shower for the stock market. Meanwhile, unemployment numbers serve as a lagging indicator, showing us the aftermath of economic shifts, yet they remain crucial for predicting consumer behavior in the coming months. Understanding the interplay between these three is like solving a puzzle where every piece affects the shape of the others. By tracking these regularly, you gain a massive advantage over those who only react to sudden headlines. Remember, markets love certainty, and tracking these metrics provides you with a much clearer picture of what to expect next.
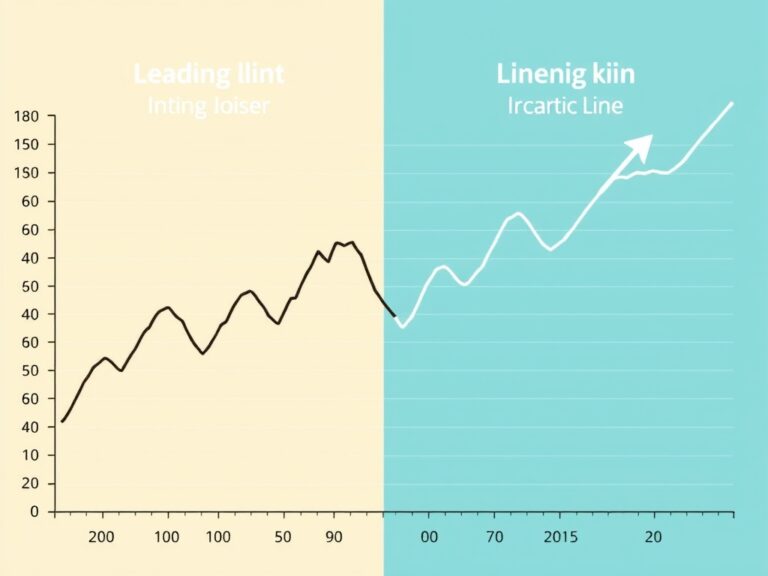
Decoding Market Trends: Leading vs. Lagging
Not all data points are created equal, and distinguishing between leading and lagging indicators is a game-changer for your strategy. A leading indicator, such as the stock market itself or building permits, is designed to predict where the economy is headed before the shift actually happens. Conversely, lagging indicators, like corporate profits or the unemployment rate, confirm a trend that has already begun, giving you a retrospective look at the state of the nation. It is easy to get caught up in the noise of daily market swings, but focusing on leading indicators helps you anticipate potential downturns or recoveries in advance. For example, when manufacturing orders drop, it is often a precursor to a wider economic slowdown that we won’t see in GDP reports for months. Conversely, when we see a steady uptick in consumer sentiment, it often signals that robust spending is just around the corner. Using a mix of both allows you to create a balanced analytical approach that prevents you from being blindsided by sudden news. If you only look at one side of the coin, you miss half the story of how our interconnected markets actually function. Stay curious, check the latest reports, and always ask: ‘What does this tell me about the next six months?’
Putting It All Together: Your Action Plan
Now that you have the vocabulary to understand economic reports, how do you actually apply this to your portfolio or your personal savings goals? The most important takeaway is that volatility is a feature, not a bug, of a functioning market. When you see a sudden headline about rising inflation or a dip in retail sales, resist the urge to panic and instead zoom out to look at the broader trends we have discussed. Consistency is your greatest asset; setting up a routine to review these indicators monthly can help you build a disciplined mindset that ignores short-term noise. You don’t need a degree in finance to make sense of these trends; you just need the willingness to look beyond the clickbait headlines. Start by following reputable sources, checking government databases like the BLS or the Federal Reserve, and keeping a journal of how these reports correlate with your own financial observations. You are now better equipped than most to interpret the complex language of the market and make decisions that align with your long-term vision. Stay patient, keep learning, and trust in the power of educated decision-making to guide your financial journey. You have the tools, so start monitoring the economy like a pro today!