

Making Sense of the Markets: A Plain-English Guide to Economic Indicators
Understanding the Economic Pulse: Why Indicators Matter
Have you ever felt like the financial news is speaking a completely different language? You aren’t alone; navigating the markets can feel like trying to solve a puzzle with half the pieces missing, but economic indicators are the keys that bring the full picture into focus. Essentially, these indicators are statistical metrics that provide insights into the health of an economy, acting as a real-time report card for businesses, investors, and policymakers alike. By tracking variables like employment rates or inflation, we can move beyond mere guessing and start making data-driven decisions that protect our portfolios. Whether you are a seasoned trader or a curious beginner, understanding these benchmarks is the first step toward true financial literacy. In this guide, we will break down the complex jargon into simple, actionable concepts that you can actually use. Remember, the market doesn’t just react to random events; it responds to trends reflected in these essential data points. Let’s strip away the confusion and dive into the numbers that move the world. Are you ready to stop guessing and start understanding the economic pulse of our global market?
The Big Three: GDP, Inflation, and Unemployment
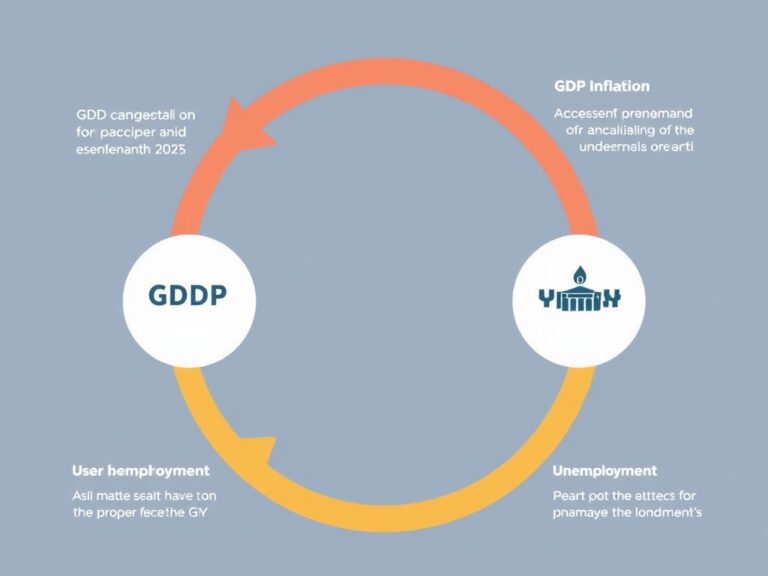
When you start digging into economic health, three specific indicators tend to dominate every conversation: GDP, Inflation, and Unemployment.
- GDP (Gross Domestic Product) measures the total value of all goods and services produced, acting as the ultimate barometer for economic growth.
- Inflation (CPI) tracks the rising costs of goods, signaling how much ‘bang for your buck’ you are actually getting.
- Unemployment Rates tell us how many people are actively seeking work, which directly influences consumer spending and market confidence.
These three metrics are deeply interconnected; for instance, high unemployment often leads to lower consumer spending, which in turn can drag down GDP growth. If inflation spikes too rapidly, central banks usually intervene by raising interest rates, which creates a ripple effect throughout the entire stock market. Think of these as the ‘vital signs’ of the economy—when they are stable, the system functions smoothly, but when they fluctuate, the markets react accordingly. By keeping an eye on these top-tier indicators, you get a solid baseline for how the broader economy is performing. It is not about obsessing over every daily change, but rather identifying the long-term trends that these indicators reveal over several quarters.
Leading vs. Lagging Indicators: A Strategic Advantage
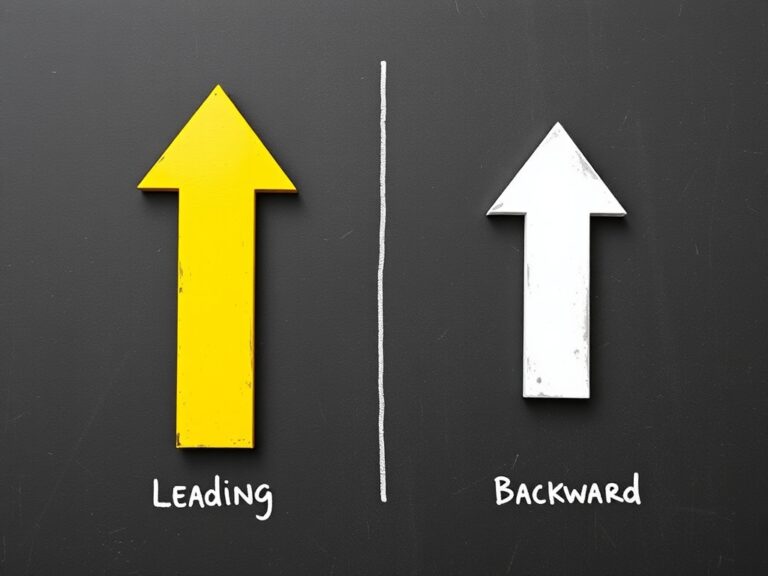
One of the most important concepts to master is the difference between leading indicators and lagging indicators. A leading indicator, such as the Stock Market or Consumer Expectations, offers a glimpse into where the economy is headed in the future. In contrast, a lagging indicator, like Corporate Profits or Unemployment Rates, confirms trends that have already taken place, serving as a reflection of past economic activity.
- Leading: Predicts future shifts, allowing investors to position themselves ahead of the curve.
- Lagging: Confirms the current state, providing necessary validation for long-term economic shifts.
Knowing which is which prevents the common mistake of reacting to ‘old news’ as if it were a new development. If you only look at lagging indicators, you might find yourself acting too late, like trying to steer a ship after you’ve already hit the iceberg. By balancing both, you build a much more comprehensive strategy that accounts for both momentum and reality. It’s about using the past to prepare for the future while remaining grounded in current market signals. Mastering this distinction is essentially what separates the informed investor from the crowd.
Putting It All Together: Your Economic Toolkit
So, how can you apply this knowledge to your everyday life and investments? Start by creating a simple Economic Calendar to track when major reports are released, as these are the moments when volatility often spikes. Don’t feel pressured to interpret every single piece of data perfectly; even expert analysts often disagree on the implications of a new report! Focus instead on the broader trends rather than the day-to-day noise that fills the headlines. When reports like the Non-Farm Payrolls or Consumer Price Index drop, observe how the market reacts and try to connect those reactions back to the core indicators we discussed. Consistency is your greatest asset in this journey toward financial awareness, so keep learning and stay curious about how these numbers influence your personal finances. Building this economic toolkit won’t happen overnight, but it will undoubtedly pay dividends in your ability to navigate the complex world of finance with confidence. Now that you have the foundation, you are better prepared than most to make sense of the markets and the indicators that drive them. Keep your eyes on the data, your mind open to the trends, and you will surely thrive.