

Making Sense of Markets: A Plain-English Guide to Economic Indicators and Trends
Understanding the Economic Pulse: Why Market Trends Matter
Have you ever glanced at a financial headline about economic indicators and felt like you were reading a foreign language? You are certainly not alone, but deciphering these signals is essentially like learning to read the weather report before you head out for the day. Market trends aren’t just dry numbers on a spreadsheet; they are the collective heartbeat of global business, consumer habits, and government policy all wrapped into one. By learning to make sense of these markers, you shift from being a passive observer to an informed participant in your own financial future. Whether you are a budding investor or just someone curious about why prices at the grocery store fluctuate, understanding these basics is incredibly empowering. We are going to strip away the jargon and look at how these indicators shape your reality. Consider this your roadmap to navigating the complex landscape of macroeconomics without needing a PhD. Let’s start our journey by demystifying the most common signals that move the needle every single day.
The Big Three: GDP, Inflation, and Employment
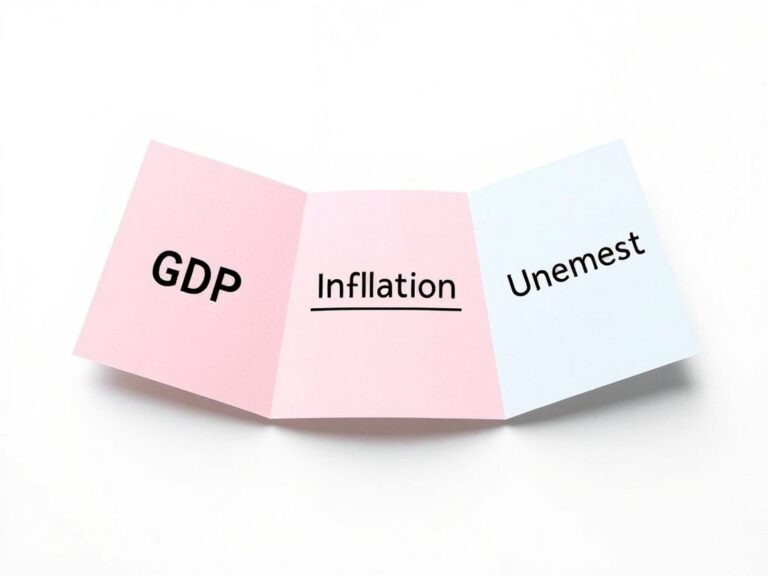
To understand the economy, we usually start with the ‘Big Three’ indicators that every expert watches like a hawk. First, there is Gross Domestic Product (GDP), which is essentially the total scorecard of everything a country produces. When GDP goes up, it generally means businesses are expanding and people are finding jobs. Second, we have Inflation, typically measured by the Consumer Price Index (CPI), which tracks how quickly the cost of living is rising. If inflation is too high, your money loses its purchasing power, which is why central banks often hike interest rates to cool things down. Third, the Unemployment Rate is perhaps the most human indicator of all; it tells us how many people are actively looking for work but can’t find it.
- GDP: The economy’s growth engine.
- Inflation: The silent tax on your savings.
- Employment: The driver of consumer spending.
These three work in tandem, creating a delicate balance that determines whether we are in a ‘boom’ or a ‘bust’ cycle. Keeping an eye on these helps you anticipate changes before they impact your wallet directly.
Reading Between the Lines: Leading vs. Lagging Indicators
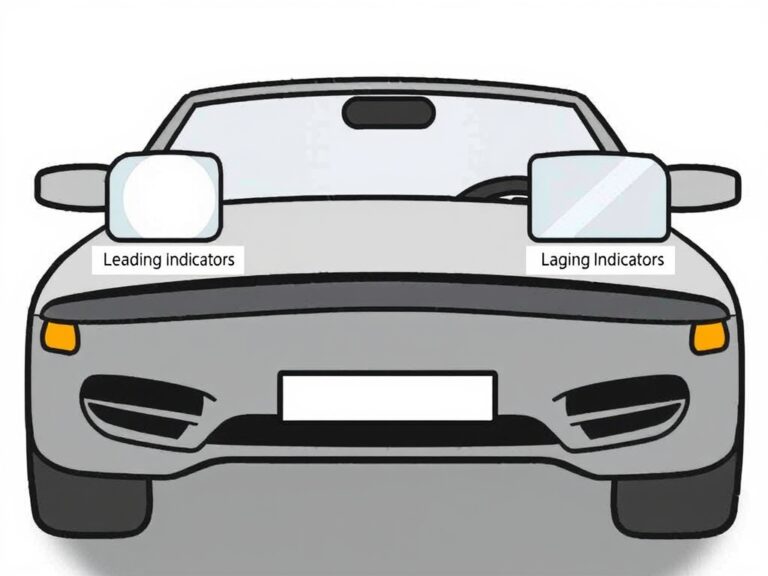
Not all data is created equal, and knowing the difference between leading and lagging indicators is a total game-changer. Leading indicators act like the headlights of your car, giving you a glimpse of where the economy is headed in the next few months. Examples include stock market performance, building permits, and consumer confidence surveys—they change *before* the economy shifts. On the flip side, lagging indicators are more like your rearview mirror, confirming trends that have already occurred. Key lagging examples include the unemployment rate and corporate profits; they tell you where the economy has been, which is still vital for long-term analysis. By mixing both, you get a much clearer picture of the current cycle. For instance, if building permits are dropping (leading) but employment is still high (lagging), you might be entering a cooling period. This insight allows you to adjust your financial expectations proactively rather than reacting in a panic. It is all about timing and context, not just reading isolated numbers.
Actionable Tips for Your Financial Strategy
So, how do you actually apply this knowledge to your daily life without getting overwhelmed? Start by checking reputable sources like the Bureau of Labor Statistics or major financial news outlets once a week rather than obsessing over hourly market swings. Remember that economic trends are usually slow-moving giants; they don’t change overnight, so there is no need for impulsive decision-making. Focus on your long-term goals and use these indicators to understand the context of the environment, not to time the market perfectly. Diversification remains your best friend; when one sector is down due to a specific economic indicator, another might be thriving. Always consider how rising interest rates might affect your specific debts, like credit cards or mortgages, and plan accordingly. By staying calm and data-driven, you transform from someone who fears market volatility into someone who prepares for it. Keep learning, stay curious, and remember that even experts were once beginners trying to decode the same charts you are looking at today!