
Economic Indicators and Market Movements: A Simple Guide in Plain English
Demystifying the Economic Dashboard: Why Indicators Matter to You
Have you ever wondered why the stock market suddenly takes a wild rollercoaster ride after a seemingly boring government report is released? Well, you are not alone, because these reports contain crucial clues known as economic indicators. Think of these indicators as the financial world’s dashboard instruments, showing whether the economy is cruising smoothly or engine trouble is brewing. For everyday investors, understanding these signals is like having a weather forecast before planning an outdoor trip. Why does this matter to you? Simply put, when the economy shifts, markets react, and your investment portfolio feels the ripple effects. In this simple guide, we will demystify how these complex reports translate into real-world market movements. We will break down the jargon into plain English so you can make informed decisions with confidence. By the end of this article, you will see how indicators shape trends in stock prices, bond yields, and interest rates. So, let’s dive in and look at the three main flavors of economic indicators:
- Leading indicators: These are the economic headlights that point to where we are heading.
- Coincident indicators: These act as the speedometer, telling us our current speed.
- Lagging indicators: These serve as the rearview mirror, confirming where we have already been.
Navigating this landscape does not require a PhD in economics, just a bit of curiosity. Let’s start by looking at the heavyweight champion of economic data: Gross Domestic Product.

Gross Domestic Product (GDP): The Ultimate Economic Scorecard
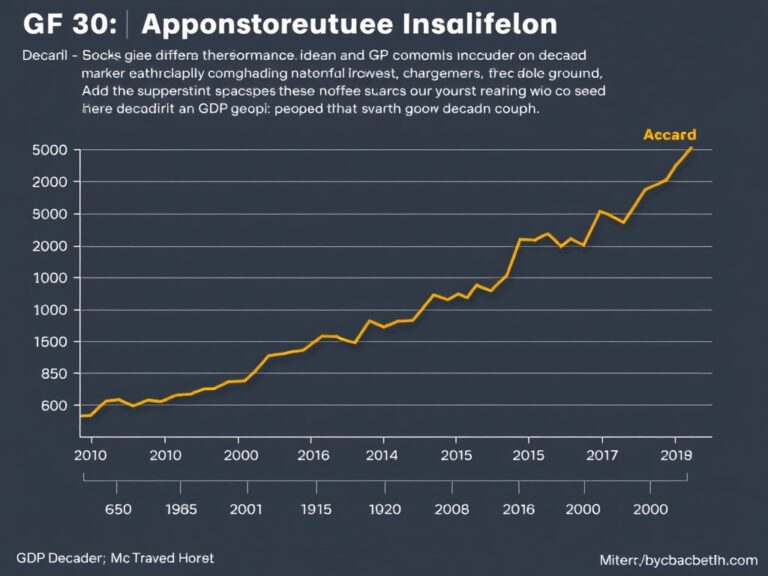
When it comes to measuring the overall health of an economy, Gross Domestic Product (GDP) is the undisputed heavyweight champion. GDP represents the total dollar value of all goods and services produced over a specific time period, usually a quarter or a year. You can think of it as the ultimate economic scorecard that tells us if a country’s economic engine is growing or shrinking. When the GDP growth rate is strong, businesses are thriving, consumers are spending, and corporate profits are generally rising. Naturally, stock markets love strong GDP growth because higher profits typically drive share prices upward. On the flip side, if GDP shrinks for two consecutive quarters, it officially signals a recession, which often triggers market anxiety. During these downturns, defensive investing strategies become highly popular as investors seek shelter from the storm. Here is how GDP movements typically influence different asset classes:
- Stocks: Generally rise during GDP expansion and fall during contraction.
- Bonds: Tend to perform better during slowdowns as interest rates fall.
- Commodities: Experience high demand and price increases when the economy is booming.
Monitoring GDP reports helps you align your portfolio with the broader macroeconomic cycle. It is a vital tool for determining whether to adopt an aggressive growth strategy or a defensive stance. However, while GDP tells us where we are, other indicators like employment data tell us how people are actually coping.
Employment and Inflation: The Dynamic Duo of Market Stability
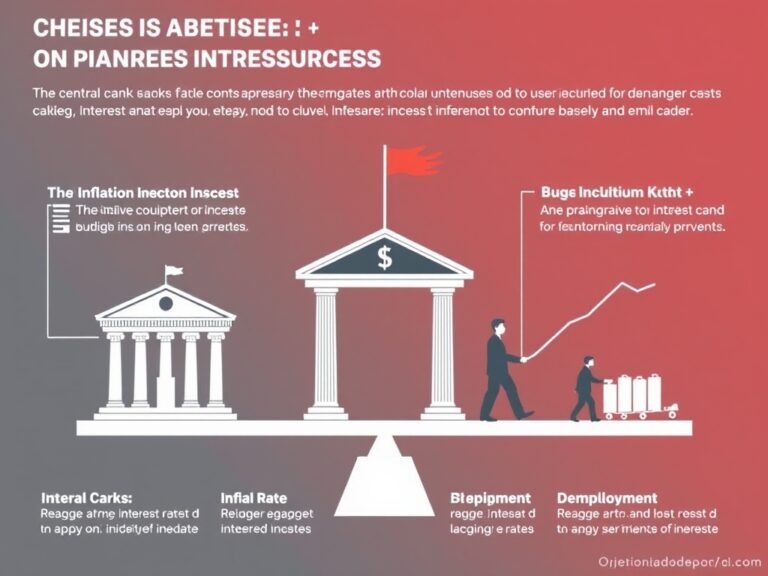
If GDP is the economic engine, then employment data and inflation are the dual throttles that control its speed. Every month, investors eagerly await the Non-Farm Payrolls (NFP) report and the Consumer Price Index (CPI) to gauge these forces. High employment means more people have paychecks, which fuels consumer spending and keeps the economic wheels turning smoothly. However, if the job market gets too hot, it can spark inflation, which is the steady rise in the prices of everyday goods. When inflation climbs too quickly, your purchasing power gets eroded, and the money in your savings account buys less. This is where central banks, like the Federal Reserve, step in to play the role of the economic thermostat. They use interest rate hikes to cool down an overheating, inflationary economy, or rate cuts to stimulate a sluggish one. Understanding this dynamic is crucial because central bank decisions directly dictate market liquidity and borrowing costs. Let us look at the typical chain reaction that occurs when inflation rises unexpectedly:
- Step 1: Inflation rises, causing the central bank to increase interest rates.
- Step 2: Borrowing becomes more expensive for businesses and consumers alike.
- Step 3: Stock prices may decline as future corporate earnings are discounted at higher rates.
Conversely, low inflation and steady employment usually create a goldilocks environment where stocks can thrive. Keeping a close eye on these monthly reports helps you anticipate monetary policy shifts before they catch the market off guard. By taking this proactive approach, you can easily transition into understanding how consumer sentiment acts as the ultimate psychological driver of these trends.
Consumer Sentiment and Retail Sales: The Power of the Pocketbook
Did you know that consumer spending accounts for nearly 70% of all economic activity in the United States? This means that the collective mood and behavior of everyday shoppers hold immense power over market movements. To track this, analysts rely heavily on the Consumer Confidence Index (CCI) and monthly Retail Sales reports. When consumers feel secure about their jobs and future income, they are much more willing to open their wallets. This surge in retail spending directly boosts corporate revenues, particularly in consumer discretionary sectors like travel and luxury goods. On the other hand, when consumer confidence plummets, people instinctively tighten their belts and prioritize saving over spending. This shift in behavior can lead to a rapid slowdown in retail sales, dragging down stock prices of major retail brands. To navigate these consumer-driven shifts, successful investors keep a close watch on these key retail trends:
- Discretionary Spending: Flourishes when confidence is high, boosting retail and tech stocks.
- Staples Spending: Remains steady even during downturns, supporting defensive stock sectors.
- Credit Usage: High credit growth can signal temporary spending power but raises debt risks.
By understanding how the average shopper feels, you can spot emerging sector trends long before they show up in quarterly earnings. It is a fantastic way to keep your pulse on the real economy rather than just Wall Street speculation. Now, let us bring all of these pieces together so you can build a resilient investment strategy.

Building a Resilient Strategy Around Economic Data
Now that you understand the key economic indicators, the real magic lies in using this knowledge to build a resilient investment portfolio. Instead of trying to time the market perfectly—which is a fool’s errand—you can use these indicators to manage your risk. When indicators point toward a slowing economy, it might be wise to tilt your portfolio toward defensive assets. Conversely, during periods of robust economic expansion, you can confidently lean into growth-oriented investments like technology and small-cap stocks. Remember, diversification remains your best shield against unexpected economic data surprises that catch the market off guard. By spreading your assets across stocks, bonds, and alternative investments, you can smooth out the volatility of individual indicators. Additionally, practicing dollar-cost averaging ensures you keep investing consistently, regardless of short-term market noise. Here are some actionable takeaways to help you apply these insights to your daily investing routine:
- Create a calendar: Mark down release dates for GDP, CPI, and NFP reports to stay prepared.
- Don’t panic-sell: Remember that short-term volatility often creates excellent long-term buying opportunities.
- Focus on the trend: Look at the broader direction of data rather than a single month’s fluctuation.
Staying informed about macroeconomic trends empowers you to make rational, data-driven decisions rather than emotional ones. It transforms investing from a stressful game of chance into a strategic journey of wealth creation. So, keep tracking the economic dashboard, stay disciplined, and let the data guide your long-term success. Happy investing, and may your financial journey be prosperous and well-informed!