Decoding the Markets: A Plain English Guide to Economic Indicators and Trends
🚀 Introduction: Decoding the Financial Matrix
Ever felt like the financial news is speaking a completely different language? You are not alone, as terms like GDP, inflation, and yield curves often sound like complex jargon designed to keep everyday investors in the dark. However, understanding these concepts is like having a compass in a stormy sea, helping you navigate the complex world of personal finance and investing. Economic indicators are simply statistics about economic activities that allow us to analyze economic performance and predict future growth. In this plain English guide, we will decode these market signals so you can make highly informed decisions with your hard-earned money. Think of the economy as a massive, living organism; these indicators are merely its vital signs, measuring things like blood pressure and heart rate. By learning how to read these signs, you transition from being a passive observer to an active, strategic participant in the market. We will break down the barriers of Wall Street terminology and translate these concepts into actionable insights you can actually use. Why does this matter to your everyday financial planning? When you understand the broader economic trends, you can better protect your portfolio, spot upcoming market opportunities, and make smarter purchasing decisions. So, grab a cup of coffee, and let us demystify the markets together in a way that actually makes sense. Together, we will look at key metrics like the Gross Domestic Product, inflation rates, and employment data. Ready to become market-literate today? Let us dive straight into the first core indicator that drives the global financial landscape.
📈 The Scorecard of Growth: Understanding Gross Domestic Product (GDP)
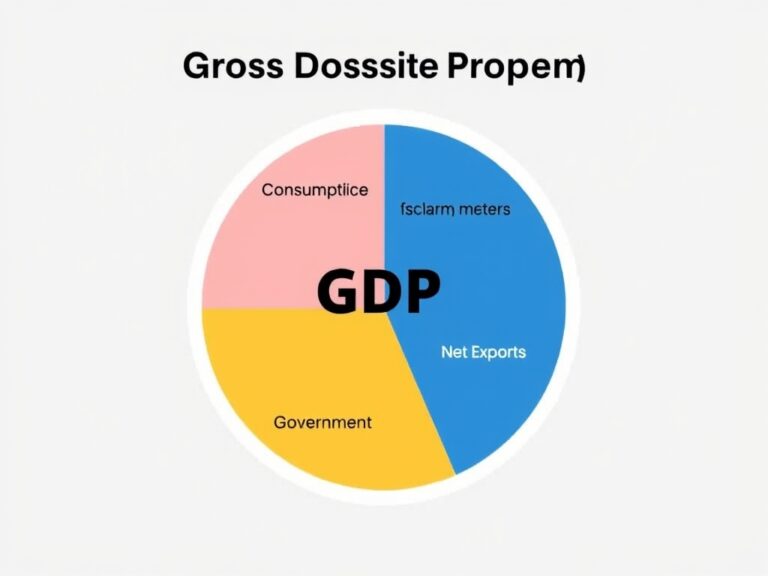
Let us start with the heavyweight champion of economic indicators, which is known as Gross Domestic Product, or GDP. In simple terms, GDP represents the total dollar value of all goods and services produced over a specific time period within a country’s borders. Think of it as the ultimate scorecard of a country’s economic health and productivity. When the GDP is growing, businesses are hiring, people are spending, and the general sentiment is highly optimistic. Conversely, a shrinking GDP for two consecutive quarters signals a technical recession, which often triggers market anxiety. To understand how GDP is calculated, it helps to look at its core components:
- Consumption represents personal spending by individuals on goods and services like groceries and cars.
- Investment includes business spending on capital goods, equipment, and residential construction.
- Government Spending covers infrastructure projects, defense, and public services funded by the state.
- Net Exports are the value of a nation’s exports minus its imports.
Knowing this formula helps you see where the money is actually flowing in the economy. For example, if consumer spending drops significantly, it tells you that the economy might be heading for a slowdown. As an investor, tracking GDP growth rates helps you decide which sectors are primed for growth. By keeping an eye on these quarterly reports, you can adjust your investment strategy before the rest of the crowd catches on.
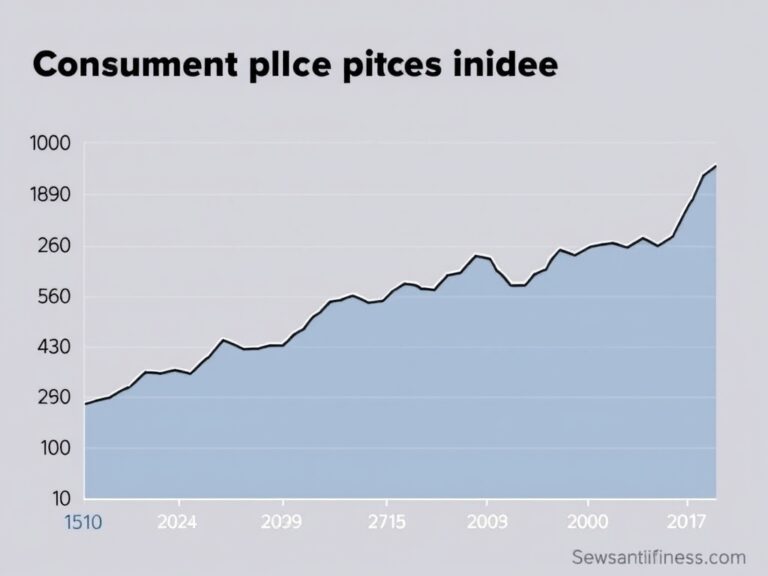
💰 The Silent Wealth Destroyer: Inflation and the Consumer Price Index (CPI)
Next, let us talk about the quiet force that directly impacts your wallet every single day, which is inflation. Inflation is simply the rate at which the general level of prices for goods and services is rising, subsequently eroding your purchasing power. To measure this, economists rely heavily on the Consumer Price Index, or CPI. The CPI acts as a representative basket of goods and services, tracking price changes for things like food, energy, housing, and healthcare. When CPI rises rapidly, your money buys less than it did before, meaning your savings are actively losing value. Central banks, like the Federal Reserve, closely monitor CPI to decide whether to adjust interest rates. If inflation is running too hot, they will raise interest rates to cool down the economy; if it is too cold, they will lower rates to stimulate borrowing. Understanding this dynamic is crucial for any investor because interest rate hikes directly influence stock and bond markets. Why should you care about this trend? When interest rates go up, borrowing costs increase for both consumers and businesses, which can slow down corporate earnings and stock market growth. To protect your assets from the silent wealth-destroying effects of high inflation, you might consider allocating funds to specific inflation-resistant assets:
- Real Estate tends to rise in value along with rental income.
- TIPS are government bonds designed specifically to keep pace with CPI.
- Commodities like gold and oil often act as strong inflation hedges.
By monitoring the CPI, you can proactively shield your wealth from getting eroded.
💼 The Engine of the Economy: Employment Data and Consumer Spending
You cannot talk about economic trends without looking at the engine that powers the entire system, which is the labor market. Employment data, particularly the monthly jobs report and the unemployment rate, is a vital indicator of economic health. When more people have jobs, they have steady income, which naturally leads to higher consumer spending. Since consumer spending drives about 70 percent of the economy, a strong job market is essential for sustained growth. Investors pay incredibly close attention to reports like the Non-Farm Payrolls (NFP). A high NFP number indicates that businesses are expanding and actively hiring, which is generally a bullish sign for stocks. However, a job market that is too tight can also spark fears of wage inflation, forcing the central bank to step in. If wages rise too quickly, businesses often pass those costs onto consumers, creating a self-reinforcing loop of higher prices. Therefore, a balanced labor market is the sweet spot that economists and investors always hope to see. If the unemployment rate starts to tick upward, consumer confidence typically drops, leading to an immediate hit to retail sales. Here are the key employment metrics you should add to your market watchlist:
- Unemployment Rate is the percentage of the labor force that is jobless and seeking work.
- Non-Farm Payrolls measures the total number of paid workers excluding farm employees.
- Average Hourly Earnings acts as a primary measure of wage inflation.
Keeping tabs on these jobs numbers allows you to gauge the actual strength of the consumer before the broader economic reports are published.
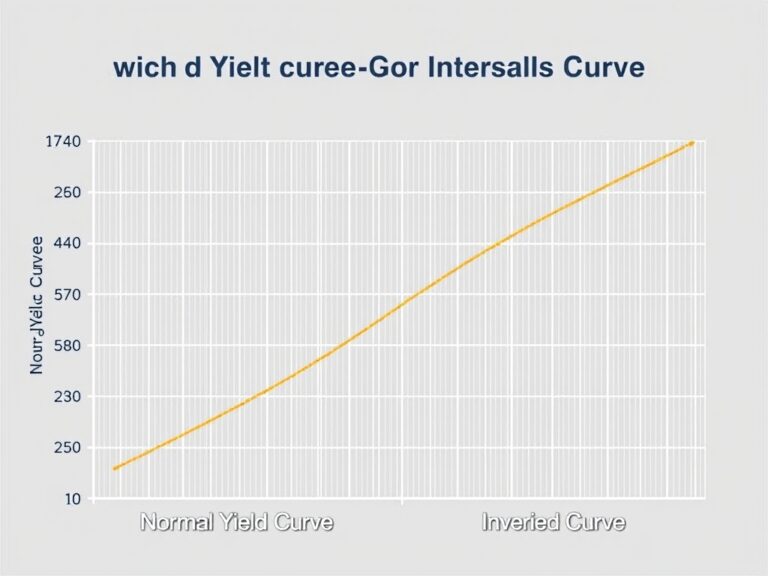
🔮 Reading the Future: Market Sentiment and the Yield Curve
While lagging indicators show us where the economy has been, leading indicators can help us see where it is going next. One of the most reliable and widely discussed leading indicators is the Treasury yield curve. The yield curve plots the interest rates of government bonds with different maturity dates, ranging from short-term to long-term. In a normal economic environment, long-term bonds offer higher yields because investors demand more compensation for locking up their money. However, when investors fear a recession is coming, they rush to buy long-term bonds, driving those yields down. This creates a phenomenon known as an inverted yield curve, where short-term interest rates are actually higher than long-term rates. Historically, an inverted yield curve has been one of the most accurate predictors of an upcoming economic recession. Along with the yield curve, tracking consumer sentiment indexes can give you a real-time pulse of the market’s psychological state. When people feel secure in their jobs and finances, they are far more likely to make large purchases like homes and cars. How can you apply this forward-looking insight to your own financial plan? If you see the yield curve invert and consumer confidence plunge, it is a strong signal to build up your cash reserves. It may also be an ideal time to transition your investments into more defensive, recession-resilient assets. By combining forward-looking market sentiment with hard economic data, you can build a robust, weatherproof financial strategy. Ultimately, decoding the markets is not about predicting the future with absolute certainty, but rather playing the probabilities to protect and grow your wealth.