Decoding the Markets: A Plain-English Guide to Economic Indicators and Trends
Understanding the Pulse of the Global Economy
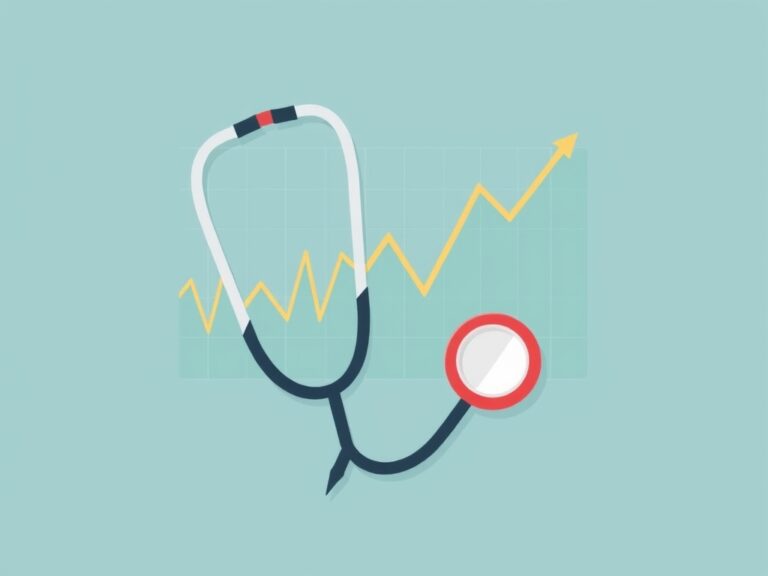
Have you ever wondered why the stock market takes a nosedive when a single unemployment report drops, or why your grocery bill seems to fluctuate with interest rates? Decoding the markets might sound like an activity reserved for Wall Street elites in tailored suits, but it is actually a skill anyone can master with a bit of curiosity. At its core, economic indicators are simply the ‘vital signs’ of a country, acting like a medical check-up for our financial health. By tracking these metrics, you can transition from feeling like a passive observer to an informed participant in your own financial future.
- GDP Growth: The total economic output.
- Inflation Rates: The silent tax on your savings.
- Consumer Confidence: The mood of the marketplace.
When you understand these indicators, you can make smarter decisions about your investments and personal budget. It is not about predicting the future with a crystal ball, but rather reading the signals that are already there. Let’s strip away the jargon and look at how these pieces fit together into the bigger economic puzzle. You will find that once you learn the language, the daily news headlines start making a lot more sense. Get ready to turn that financial confusion into genuine clarity today!
The Big Three: GDP, Inflation, and Employment
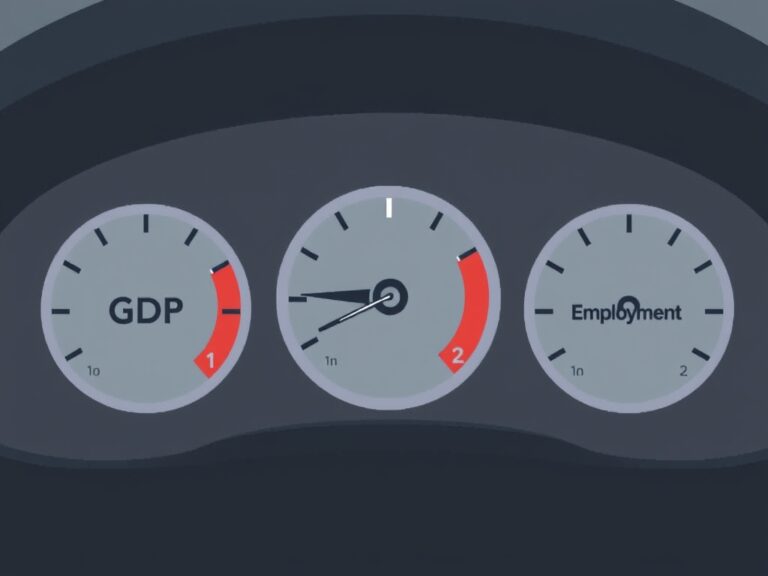
To truly get a handle on market trends, we need to focus on the heavy hitters that move the needle: GDP, Inflation, and Employment data. Gross Domestic Product (GDP) is essentially the total scorecard of a nation’s goods and services, telling us if the economy is expanding or contracting. Meanwhile, inflation acts as the temperature gauge; a little bit of warmth is healthy, but ‘overheating’ leads to soaring prices that erode your purchasing power. Employment figures, specifically the non-farm payrolls, provide the most direct insight into the strength of the labor market and consumer demand. When people are employed, they spend; when they spend, businesses grow, and the cycle continues in a virtuous loop.
- Low unemployment signals a robust, competitive economy.
- High inflation often triggers central bank intervention via interest rates.
- Stagnant GDP growth can be a harbinger of a potential recession.
By keeping a close eye on these three metrics, you can spot shifts in the economic climate long before they hit the evening news. It is like having a weather report for your money, allowing you to prepare for a rainy day or capitalize on a sunny forecast. Never underestimate the power of these fundamental reports to dictate long-term market direction. Each release offers a snapshot of current reality, helping us adjust our strategies accordingly.
Interest Rates and the Role of the Central Bank
If the economy were a vehicle, interest rates would be the brake and the gas pedal combined, operated by the central bank. When the economy is moving too fast and inflation spikes, the central bank raises interest rates to cool things down and encourage saving over spending. Conversely, if growth stalls, they lower rates to make borrowing cheaper, effectively ‘stepping on the gas’ to stimulate investment and consumption. This delicate dance is what we call monetary policy, and it has a direct impact on your mortgage, credit card APRs, and business loans.
- Rising rates increase the cost of debt, which can slow down housing markets.
- Lower rates often boost the stock market as businesses find it cheaper to expand.
- The bond market is particularly sensitive to these shifts in policy expectations.
Understanding how these interest rate decisions flow through the system is vital for any serious investor. When you grasp this concept, you stop fearing market volatility and start anticipating the moves that cause it. It is a game of cause and effect, where every policy shift creates ripples across global financial sectors. Keep your eyes on the central bank meeting calendars, as these dates are often the most influential days in the financial calendar.
Putting It All Together: Your Strategy for Success
Now that we have decoded the basics, how do you actually use this information without getting overwhelmed by the constant stream of economic data? The secret lies in focusing on long-term trends rather than the daily noise that creates short-term market panic. Start by building a routine: check the monthly economic calendar, set Google Alerts for major indicator releases, and read financial summaries that provide context rather than just headlines.
- Don’t panic over one bad report; look for multi-month trends.
- Focus on your personal goals and risk tolerance, not just the market’s mood.
- Diversify your assets to weather the storms caused by economic cycles.
Remember that economic indicators are lagging or coincident measures; they tell you where we are or where we have been, not necessarily where we are headed tomorrow. By maintaining a disciplined approach and keeping your emotions in check, you can navigate the ups and downs with confidence. Knowledge is your greatest asset in a world of uncertainty, so keep learning and stay curious. You now have the fundamental toolkit to decode the markets for yourself, so go forth and make informed choices. Your future self will thank you for the time you spent mastering these essential economic concepts today!