

Decoding Market Movements: A Plain-English Guide to Economic Indicators
Have you ever stared at financial news headlines, watching the stock market swing wildly, and wondered what on earth is driving all the chaos? Well, the secret lies in decoding economic indicators—the vital signs of our financial health that professional investors watch like hawks. Think of these indicators as a massive dashboard for the global economy, giving us clues about where we are headed next. Today, we are breaking down these complex terms into plain English so you can navigate the markets with confidence. Let’s start with the undisputed heavyweight champion of economic data: Gross Domestic Product (GDP).
👑 Gross Domestic Product: The Economy’s Report Card
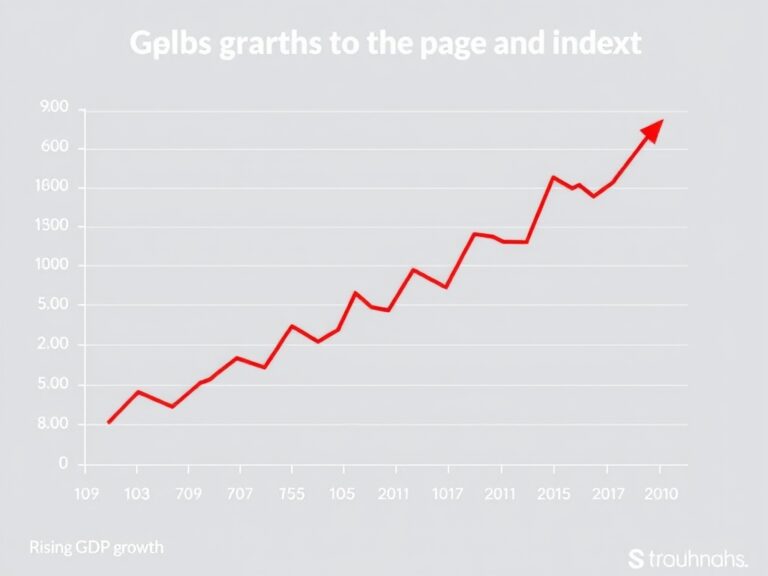
GDP represents the total dollar value of all goods and services produced within a country over a specific period. When GDP is growing, it means businesses are thriving, people are spending, and the economy is robust. Conversely, a shrinking GDP for two consecutive quarters signals a recession, which often sends stock prices tumbling. As an investor, tracking GDP growth helps you understand whether we are in an expansionary phase or heading for a slowdown. Here is why GDP matters to your portfolio.
- Corporate Earnings: Strong GDP growth translates directly to higher corporate revenues and stronger stock prices.
- Market Sentiment: A positive GDP surprise boosts investor confidence, driving capital into riskier assets like equities.
- Strategic Allocation: Understanding GDP trends allows you to rotate your investments into sectors that thrive during expansions.
By keeping a close eye on quarterly GDP releases, you can position your investments ahead of major market shifts rather than reacting after the fact. Ultimately, mastering GDP is your first step toward transforming noisy financial news into actionable, profit-generating insights.
If GDP is the economy’s report card, then employment data is the engine that actually powers the vehicle. After all, a healthy economy relies heavily on consumer spending, and people cannot spend money if they do not have jobs. This is why Wall Street holds its breath on the first Friday of every month for the release of the Non-Farm Payrolls (NFP) report.
💼 The Employment Engine: Non-Farm Payrolls & Unemployment
The NFP report measures the number of new jobs created in the United States, excluding agricultural, government, and non-profit workers. Along with the NFP, the overall unemployment rate gives us a clear picture of labor market tightness. When job creation is high and unemployment is low, consumers feel financially secure and spend more freely on retail, travel, and housing. However, an exceptionally tight labor market can also lead to wage inflation, forcing central banks to intervene. For smart investors, interpreting employment reports involves looking at three critical metrics.
- Job Growth: A consistent monthly job gain of over 200,000 indicates a highly resilient and growing economy.
- Wage Growth: Rising hourly earnings boost consumer demand but can also squeeze corporate profit margins.
- Unemployment Rate: A low unemployment rate is bullish for stocks but may trigger interest rate hikes to cool inflation.
Consequently, a surprise drop in job numbers can cause immediate stock market volatility as traders fear economic slowing. Conversely, a blockbuster jobs report signals economic strength, though it might spark concerns about upcoming interest rate increases. By understanding this delicate balance, you can better anticipate how the Federal Reserve might react to the latest employment data.
Once we understand the jobs market, we must tackle the economic silent killer that eats away at our purchasing power: inflation. Inflation measures the rate at which the general level of prices for goods and services is rising over time.
📈 Inflation Under the Microscope: Understanding CPI and PPI
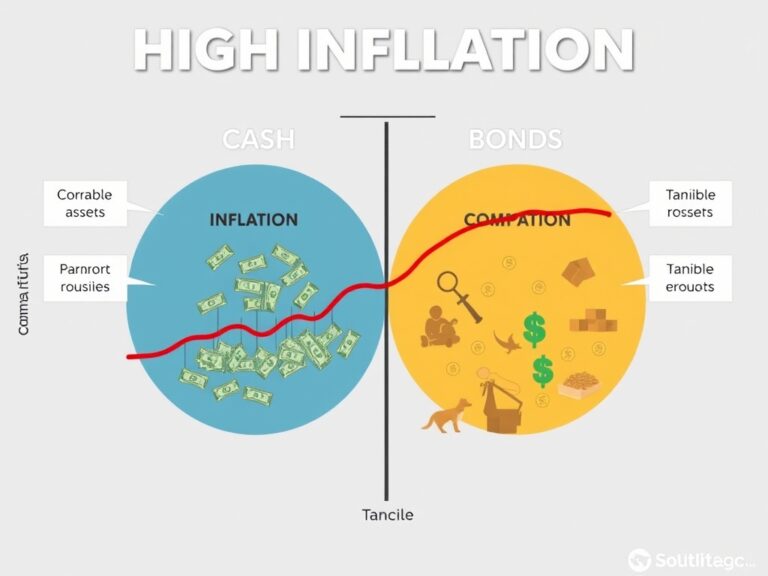
The primary tool used to measure this phenomenon is the Consumer Price Index (CPI), which tracks price changes for a basket of everyday consumer goods. Another vital metric is the Producer Price Index (PPI), which measures inflation from the perspective of the businesses producing those goods. When inflation climbs too high, your money buys less, forcing consumers to cut back on non-essential spending. For investors, high inflation is a major red flag because it erodes real investment returns and compresses corporate earnings. Fortunately, you can protect your wealth by understanding how inflation directly impacts different asset classes.
- Bonds: Fixed income assets suffer during high inflation because the purchasing power of future interest payments declines.
- Stocks: Companies with high pricing power can pass costs to consumers, while growth stocks often face severe valuation compressions.
- Commodities: Hard assets like gold, real estate, and oil historically serve as excellent hedges during inflationary periods.
To combat runaway inflation, central banks will raise interest rates, which increases borrowing costs and slows economic activity down. Monitoring monthly CPI reports allows you to adjust your portfolio to protect against inflation or capitalize on cooling prices. Recognizing these inflation trends is crucial for safeguarding your wealth and maintaining strong long-term purchasing power.
Now that we have covered jobs and inflation, we can look at the ultimate lever controlling the economic machine: interest rates. Set by central banks like the Federal Reserve, interest rates represent the cost of borrowing money across the entire economy.
🏦 Central Banks and Interest Rates: Steering the Financial System
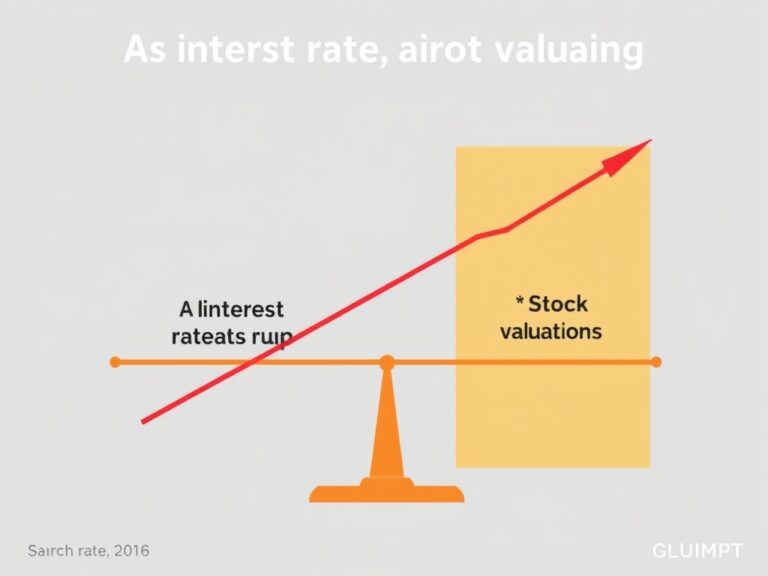
When the economy is growing too fast and inflation is rising, central banks hike interest rates to cool things down. Conversely, during a recession, they slash rates to make borrowing cheaper, encouraging businesses to invest and consumers to spend. These policy shifts create massive ripples throughout the financial markets, impacting everything from mortgages to stock prices. As a savvy investor, you must understand how changes in monetary policy influence different sectors of the stock market. Let’s explore how interest rate fluctuations typically affect these key financial areas.
- Growth Stocks: High interest rates discount future earnings, often leading to sharp sell-offs in technology and speculative sectors.
- Financial Sector: Banks and lending institutions often benefit from higher rates because their net interest margins expand.
- Dividend Stocks: Yield-paying sectors like utilities face competition when safe treasury bonds begin offering higher yields.
By tracking Fed meetings and policy statements, you can anticipate shifts in liquidity before they catch the broader market off guard. Remember, fighting the central bank is a losing game, so aligning your portfolio with monetary policy is always a winning strategy.
Finally, we must analyze the psychological side of the economy by looking at consumer confidence and retail sales. Since consumer spending accounts for nearly 70% of economic activity, how everyday people feel about their financial future is highly predictive.
🛒 Consumer Sentiment: The Psychological Driver of Markets
If consumers are worried about job security or rising prices, they will save their money and avoid major purchases. This drop in spending directly hurts business revenues, leading to a slower economy and falling stock prices. To gauge this sentiment, economists monitor indexes like the Consumer Confidence Index (CCI) and monthly Retail Sales reports. High consumer confidence is a strong leading indicator of economic health, pointing to robust future growth. When analyzing these consumer-driven indicators, pay close attention to these vital economic signals.
- Discretionary Spending: Strong retail sales in luxury goods and entertainment signal that consumers have ample disposable income.
- Credit Expansion: Rising credit card balances can boost short-term spending but might point to future consumer distress.
- Savings Rates: An increasing savings rate shows cautious behavior, which can slow down short-term economic momentum.
By combining consumer psychology with hard economic data, you gain a holistic view of market trends. Armed with this knowledge of economic indicators, you can confidently build a resilient, long-term investment portfolio that withstands any economic cycle.