
Market Trends Explained: A Plain-English Guide to Understanding Economic Indicators
Understanding the Pulse of the Global Market
Have you ever watched the evening news and felt like the reporters were speaking a secret, complex language regarding economic indicators? You are certainly not alone in feeling that way, but understanding these trends is the key to mastering your personal and business finances. At its core, an economic indicator is simply a data point—like a thermometer for the economy—that tells us whether things are heating up or cooling down. 📈 Whether it is the stock market movements, unemployment rates, or consumer spending, these metrics provide a roadmap for where we are headed. Think of it like a GPS for your portfolio; without it, you are just driving blind in a dense fog. By learning how to read these signs, you move from being a passive observer to an informed participant in the global marketplace. We will break down these complex ideas into plain English so you can make smarter, more confident decisions every single day. Let’s start by demystifying the most common terms you see in your feed. It really is much simpler than the pundits make it sound, provided you know exactly which data points actually move the needle for your bank account. Get ready to turn that confusing noise into clear, actionable intelligence that will serve you for years to come.
The Big Three: GDP, Inflation, and Unemployment
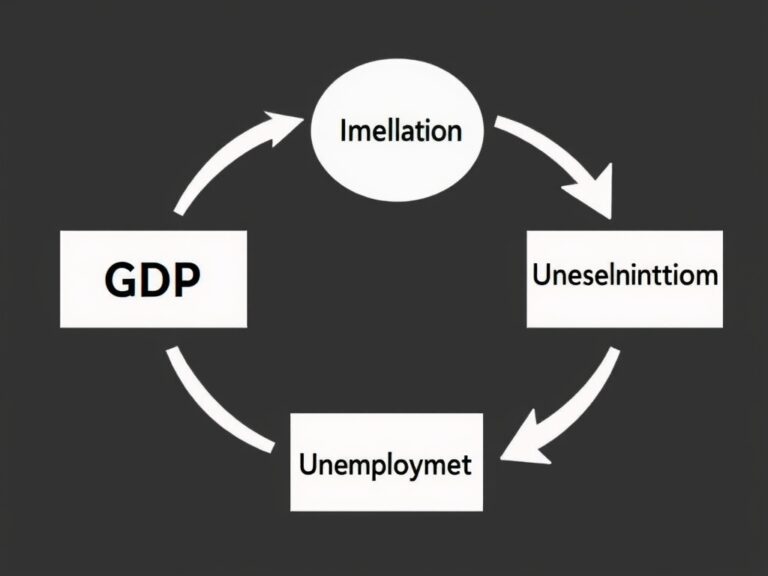
When experts talk about market trends, they are almost always circling back to the ‘Big Three’ metrics that define our reality: GDP, Inflation, and the Unemployment Rate.
- GDP (Gross Domestic Product): This measures the total value of goods and services produced in a country; think of it as the scoreboard for economic activity.
- Inflation: This tracks how quickly prices are rising, which directly impacts your purchasing power over time.
- Unemployment: This tells us how many people are looking for work, which acts as a massive signal for consumer health.
When GDP is rising, businesses are typically expanding, which usually means more jobs and higher consumer spending. However, if inflation runs too hot, your dollar buys less at the grocery store, forcing central banks to step in with interest rate changes. It is a delicate balancing act that requires constant monitoring by experts worldwide. If unemployment spikes, it acts as a warning light that the economy might be heading toward a contraction or recession. Mastering these three concepts gives you 90% of the clarity you need to understand current market volatility. By keeping an eye on these releases, you can anticipate shifts in the economy before they fully materialize in your daily expenses. Always remember that these indicators are interconnected, creating a ripple effect that touches every sector of the market.
Why Interest Rates Rule Everything Around Us
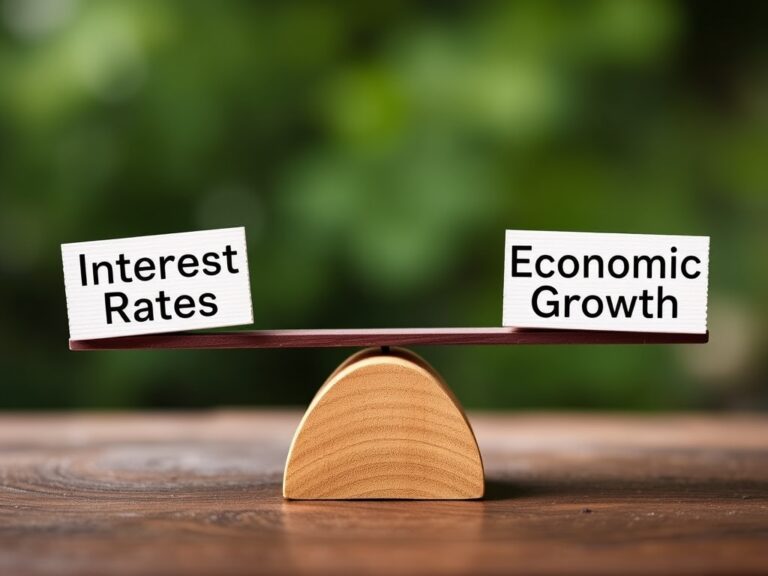
If there is one indicator that keeps investors up at night, it is definitely the Federal Reserve’s interest rate policy. 🏦 Interest rates are essentially the ‘cost of money’; when they are low, borrowing is cheap, which encourages companies to build and families to buy houses. When rates are high, borrowing becomes expensive, which cools down spending and tries to bring inflation under control. This process is a massive lever that influences everything from your mortgage payments to the yield on your high-yield savings account. Pro tip: Always watch the Fed’s ‘dot plot’ forecasts to understand where policymakers think rates are heading in the future. When rates rise, tech stocks and growth companies often face pressure, while financial institutions might see improved profit margins. It is a classic trade-off that defines the current market landscape for both professional traders and everyday savers. Understanding this relationship helps you reposition your assets to withstand periods of tightening or benefit from times of expansion. Never underestimate the power of these central bank announcements on your personal wealth. You do not need to be an economist to see how these policy changes eventually trickle down to your personal wallet or business strategy. Stay informed, stay flexible, and watch how the ‘cost of money’ dictates the direction of the broader market.
Putting It All Together: Your Actionable Strategy
Now that you have a grasp of the fundamentals, how do you apply this to your life without getting overwhelmed? 💡 The most successful investors do not try to time every single dip; instead, they focus on long-term trends identified by these key indicators. You should consider setting up Google Alerts for terms like ‘Consumer Price Index’ or ‘Jobs Report’ to stay in the loop without checking the news constantly. Remember: A single month of data is just noise; look for the multi-month trend to get the real story behind the numbers. It is also wise to diversify your holdings so that you are not overly exposed to one specific economic outcome. If you are worried about inflation, consider assets that have historically held their value during price surges. If you fear a recession, ensure you have an emergency fund that provides you with a solid financial cushion. Education is your best defense against market fear and uncertainty in the modern world. By viewing the economy through the lens of these indicators, you can make decisions rooted in logic rather than emotion. You are now equipped with the vocabulary and the framework to navigate any market cycle that comes your way. Keep learning, keep analyzing, and continue building your financial future with confidence, knowing that you finally understand the trends driving the world today!