
Decoding the Markets: A Plain-English Guide to Economic Indicators and Trends
Decoding the Markets: Your Gateway to Financial Literacy
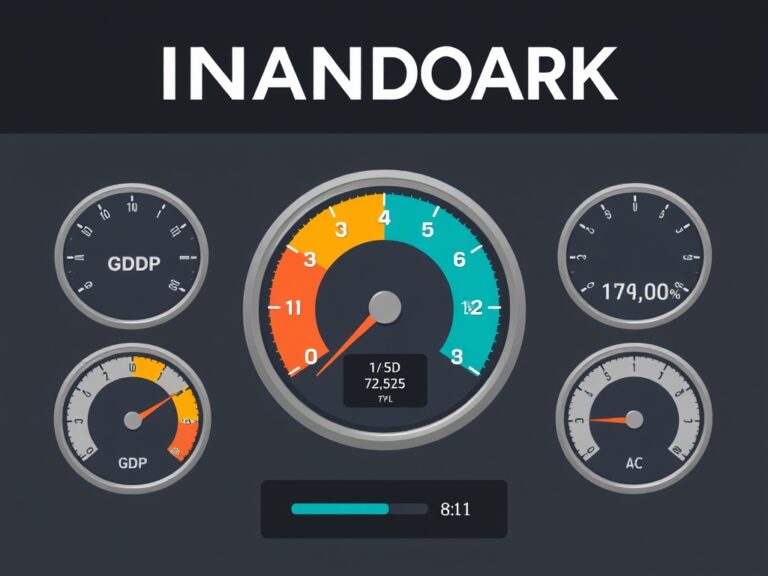
Have you ever looked at a financial news headline and felt like you were reading a foreign language? You aren’t alone, as economic indicators can feel overwhelming, but they are simply the pulse of our global economy. Think of these indicators as a dashboard for your car; they tell you when you need to speed up, slow down, or check the engine before something breaks. In this guide, we will peel back the layers of complexity to show you how data like GDP, inflation, and unemployment shape the world around us. Mastering these concepts isn’t just for Wall Street professionals; it is a vital skill for anyone looking to make smarter financial decisions in their personal life. By the end of this post, you will feel confident navigating complex market trends with ease and clarity. We will break down why these numbers matter, how they interact with each other, and how they ultimately influence your wallet. Let’s dive into the fascinating world of economics and learn how to decode the signals that move the global market today. You might be surprised to find that these indicators are more intuitive than you once thought!
The Big Three: GDP, Inflation, and Employment
To really understand market trends, you need to focus on the ‘Big Three’ indicators that act as the backbone of economic analysis. First, Gross Domestic Product (GDP) measures the total value of goods and services produced, serving as the ultimate report card for national health. Second, Inflation—often measured by the Consumer Price Index (CPI)—tells us how much the cost of living is rising over time. Third, the Unemployment Rate gives us a window into the strength of the labor market and consumer purchasing power. These indicators often move in tandem, creating a cause-and-effect relationship that experts analyze daily. For instance, when unemployment is low, consumer spending typically rises, which can inadvertently push inflation higher if supply cannot keep up. Understanding these three pillars allows you to form a baseline for any market analysis you undertake.
- GDP: The total size of the economic engine.
- CPI: The hidden tax of rising living costs.
- Unemployment: The measure of workforce vitality.
Watching these indicators helps you anticipate shifts before they become mainstream headlines, giving you a distinct advantage as an informed observer.
Reading Between the Lines of Interest Rates
Perhaps no signal is as powerful or as closely watched as interest rates set by central banks. When central banks adjust these rates, it creates a ripple effect that touches everything from your mortgage payments to your credit card balances. Higher interest rates are typically used to cool down an overheating economy and fight runaway inflation, making borrowing money more expensive for businesses and individuals alike. Conversely, lower interest rates are used to stimulate growth by making capital cheaper to access during economic downturns. You can think of interest rates as the ‘throttle’ of the global financial system, carefully managed to maintain a balance between growth and stability. If you are planning on making a large investment, keeping a close eye on central bank rhetoric is non-negotiable. It is not just about the rate today; it is about the *expected trajectory* of those rates in the coming months. Smart investors look for clues in central bank minutes and press conferences to see where the wind is blowing. Understanding this mechanism is key to decoding why markets react so violently to seemingly small policy changes in the financial sector.
Turning Data Into Actionable Insights
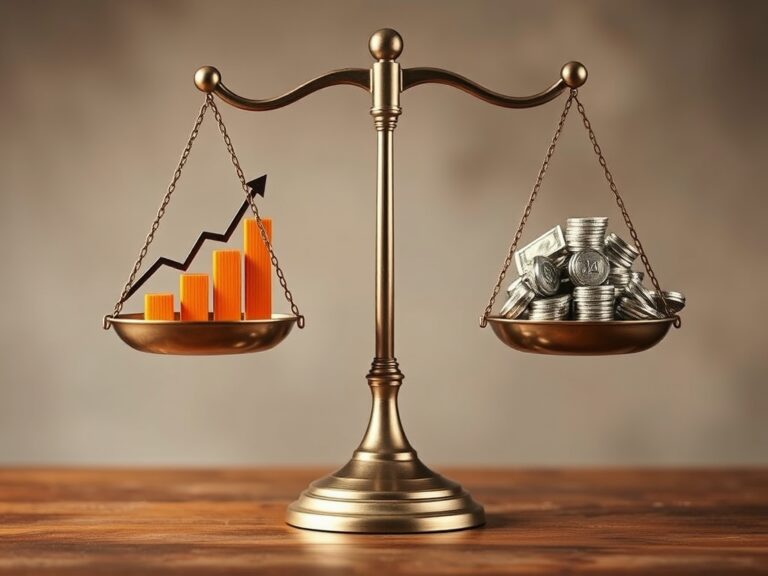
So, how do you take all these numbers and turn them into actionable insights for your own financial journey? The goal is not to predict the future with 100% accuracy, but to understand the probabilistic outcomes of current trends. Start by tracking these indicators consistently using reputable financial news outlets or government portals to avoid being swayed by biased analysis. Look for the underlying narrative: Are businesses hiring? Is consumer confidence trending upward? Are commodity prices signaling potential supply chain bottlenecks? By connecting these dots, you move from being a passive consumer of news to an active participant in your financial future. Remember that the market is often forward-looking, meaning it reacts to what investors *think* will happen rather than just what has happened. Building your own framework for interpreting these trends will empower you to make decisions based on logic rather than panic or hype. Stay curious, keep reading, and eventually, the jargon will become second nature to you as you master the language of the markets. Your path to financial literacy starts with one indicator at a time, so keep building that foundation daily!