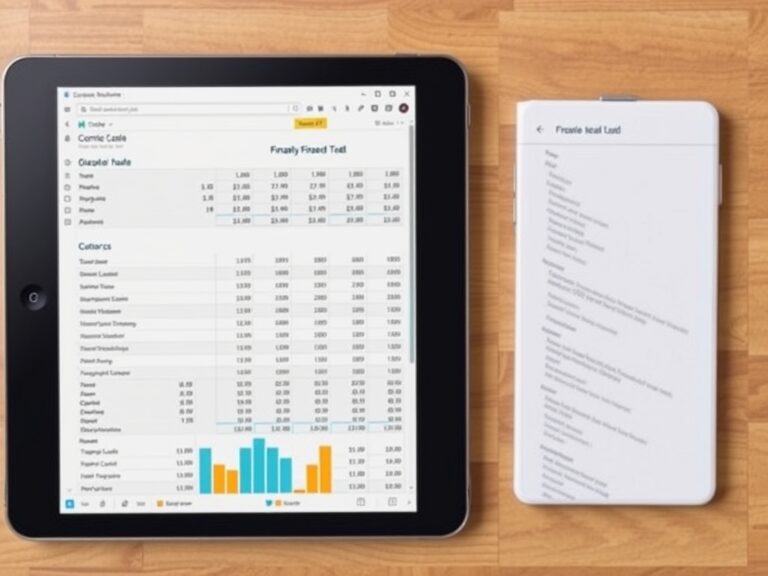
Market Analysis Made Simple: Understanding Economic Indicators and Trends
Decoding the Market: Why Economic Indicators Matter
Have you ever felt like the stock market is a giant puzzle where the pieces are constantly shifting? You are not alone, but the secret to Market Analysis Made Simple lies in understanding the core pulse of the economy through economic indicators. Think of these indicators as the dashboard of your car, providing vital data like speed, fuel levels, and engine temperature before a breakdown occurs. When we analyze trends, we aren’t just looking at random numbers; we are interpreting the health of businesses, consumer confidence, and government policy. By learning to read these signals, you gain a competitive edge in your investment strategy or business planning. We will break down how to filter the noise so you can make data-driven decisions with confidence. Understanding these metrics doesn’t require a PhD in economics; it just requires a bit of curiosity and the right guide. Let’s simplify this together so you can start spotting opportunities long before they hit the mainstream news cycle. Grab a cup of coffee, and let’s dive into the fascinating world of macro trends.
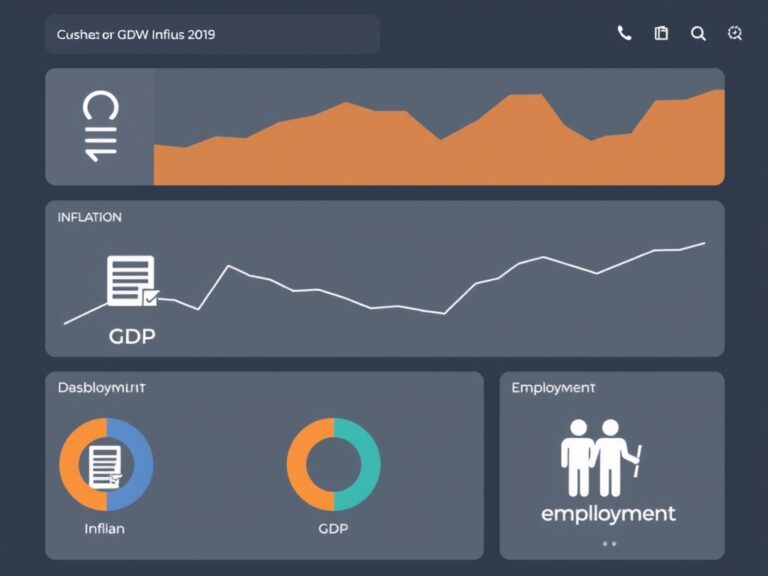
The Big Three: GDP, Inflation, and Unemployment
To master market analysis, you must first get comfortable with the ‘Big Three’ metrics that define our economic reality. First, Gross Domestic Product (GDP) acts as the ultimate scorecard, measuring the total value of goods and services produced within a country. Second, we look at inflation, specifically the Consumer Price Index (CPI), which tells us how fast the cost of living is rising or falling. Third, the unemployment rate provides a crucial insight into labor market health, which directly impacts consumer spending power. When these three interact, they create a story about whether the economy is in a period of expansion or contraction.
- GDP growth signals corporate health and potential for stock market gains.
- Low inflation usually promotes stable purchasing power for average families.
- Healthy employment fuels consumer demand for products and services.
If you ignore these, you are essentially flying blind in a volatile market environment. Learning to cross-reference these indicators helps you anticipate shifts before they become obvious to everyone else. By tracking these consistently, you create a baseline for your own internal ‘market compass.’
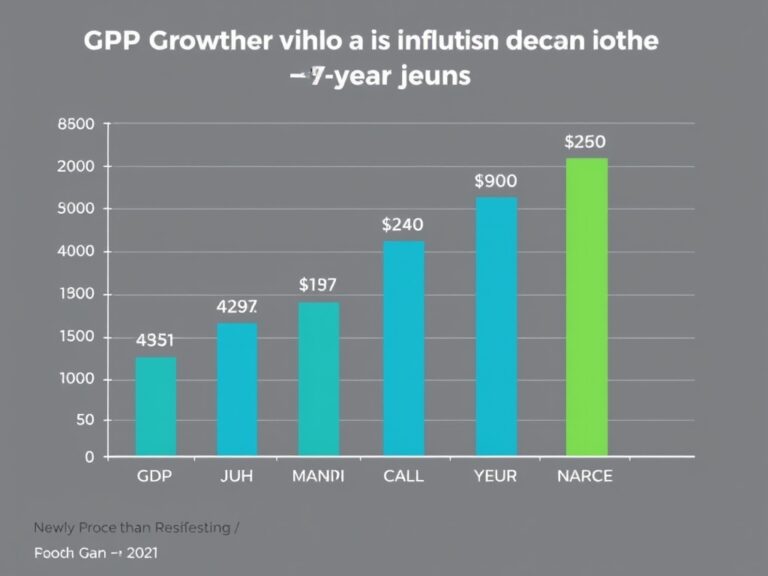
Identifying Trends Before They Peak
Many investors get caught in the trap of chasing trends that have already peaked, but true analysis involves looking for the ‘leading indicators.’ These are data points that change before the overall economy follows suit, giving you a head start on the cycle. Examples include housing starts, manufacturing orders, and stock market performance itself, which often anticipates economic shifts by months. You can also monitor yield curves to see if experts are predicting a recession or a long-term bull run. Keeping an eye on these trends allows you to pivot your assets or business strategies without the panic of a sudden crash.
- Follow industry-specific reports to see where capital is flowing first.
- Look at consumer sentiment indices to predict future spending habits.
- Analyze interest rate changes set by central banks as they dictate the cost of borrowing.
It is essentially about connecting the dots between current sentiment and future capacity. Don’t just look at the news; look at the data driving the news for a clearer, more objective view. By staying ahead of the curve, you stop reacting to the market and start anticipating it effectively.
Tools and Final Thoughts for Success
Now that you have a better grasp of the indicators, how do you put this into practice every single day? Start by utilizing free, high-quality sources like the Bureau of Labor Statistics, the Federal Reserve Economic Data (FRED), or trusted financial news platforms. You don’t need a Bloomberg terminal to be successful; you just need to be consistent with your reading and data tracking. Set up a simple spreadsheet or a digital journal where you record these metrics monthly to see the long-term trends for yourself. Consistency is the key to turning raw data into actionable wisdom that can transform your financial life. Remember that market analysis is an iterative process, and even the most seasoned experts are constantly learning and adapting. Stay patient, keep your emotions out of the charts, and focus on the long-term story. Whether you are an entrepreneur or an individual investor, these tools will serve you well. If you have questions about specific indicators or want to discuss a current trend, feel free to drop a comment below. Let’s keep the conversation going and make market analysis a standard part of your routine! Success is just one data point away.