

Understanding Market Trends: A Plain-English Guide to Economic Indicators
Understanding the Pulse of the Economy
Have you ever wondered why the stock market dips when a report comes out or why your groceries seem to cost more than they did last month? Understanding market trends can feel like trying to solve a complex puzzle, but at its core, it is simply about watching the right economic indicators. Think of these indicators as the vital signs of our national health, similar to how a doctor checks your blood pressure or heart rate. By learning to interpret data like GDP growth and unemployment rates, you can stop guessing and start making informed financial decisions. Whether you are a budding investor or just someone curious about the world, grasping these concepts is a game-changer. We are going to break down these big terms into plain-English, conversational insights that actually make sense. You do not need a degree in finance to get ahead; you just need to know where to look. Let’s demystify these trends together and see what they really mean for your wallet. It is time to turn the noise of the news cycle into clear, actionable knowledge. Are you ready to become an economic detective and uncover the patterns behind the headlines?
Key Indicators That Move the Needle
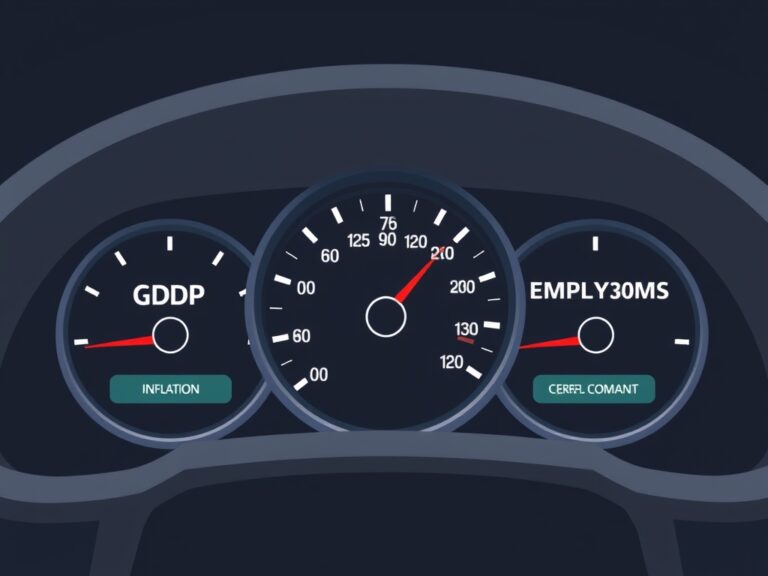
To really get a handle on market trends, you need to focus on a few heavy hitters in the world of statistics. First up is the Gross Domestic Product (GDP), which is basically the total value of everything a country produces. When GDP goes up, it usually means businesses are thriving and people are spending, which is a great sign for the economy. Next, we have Consumer Price Index (CPI), a fancy term for tracking inflation—or simply, how fast prices are rising. Keeping an eye on Employment Reports is also essential because when more people have jobs, the economy naturally has more fuel to grow. It is helpful to visualize these as a dashboard for your financial life:
- GDP: The engine speed.
- CPI: The temperature gauge for costs.
- Non-Farm Payrolls: The fuel tank levels.
By keeping these indicators on your radar, you can predict shifts before they happen. Remember, these are just snapshots in time, so looking at the long-term trend line is always more accurate than focusing on a single, shocking headline. Stay patient, stay curious, and always keep the big picture in focus.
Interpreting the Data Like a Pro
Now that you know the key terms, let’s talk about how to read them without getting a headache. Many people make the mistake of reacting to short-term volatility as if it were a permanent state of affairs. Expert insights suggest that it is much better to watch for recurring patterns rather than one-off spikes in data. For instance, if you see high inflation paired with stagnant wage growth, it is a sign that consumer spending might slow down soon. It is a balancing act; the Federal Reserve often adjusts interest rates to keep these factors in check. If you notice the Central Bank talking about ‘tightening’ or ‘loosening,’ they are adjusting the dial to prevent the economy from overheating or freezing. It is like being a thermostat manager for the entire nation. By tracking these adjustments, you can align your own financial planning to weather any potential market storms. You don’t need to overcomplicate things; just watch how these variables move relative to one another. Keep a simple log of the major headlines and see if you can spot the correlation over three or six months.

Your Roadmap to Financial Awareness
Wrapping this up, the most important takeaway is that market trends are not magic; they are just reflections of our collective behavior. By keeping yourself educated on these economic indicators, you gain a sense of control over your financial narrative. Start small: spend ten minutes a week checking sites like the Bureau of Labor Statistics or major financial news outlets. You will start to see the connections between policy changes, company earnings, and the price of goods in your local store. Knowledge is not just power; it is the ultimate buffer against uncertainty in a volatile world. Keep your head on straight, do not chase every trend you see on social media, and focus on the data that truly impacts your reality. You are now equipped with the vocabulary and the mindset to understand the forces shaping your life. Take this knowledge, apply it to your savings and investment strategies, and keep looking ahead. The more you watch, the clearer the picture becomes, and the better prepared you will be for whatever the economy does next. Cheers to your journey toward total financial literacy!