Decoding Market Trends: A Plain-English Guide to Economic Indicators
Understanding the Economic Pulse: Why Market Indicators Matter
Have you ever wondered why the stock market seems to dance to its own rhythm, even when everything feels fine on your block? Decoding market trends isn’t just for Wall Street gurus; it’s a vital skill for anyone looking to make smarter financial decisions. Think of economic indicators as the dashboard of a car—they tell you how fast the economy is going, if it’s overheating, or if you’re running low on fuel. When we look at indicators like GDP or unemployment rates, we are essentially reading the vital signs of a nation’s prosperity. Understanding these data points helps you move from just guessing to making informed moves with your investments. You don’t need a PhD in economics to get the gist, either; you just need to know what to watch. In this guide, we will break down the most impactful indicators into plain, conversational English that actually makes sense. By the end, you will feel much more confident parsing headlines about interest rates and inflation. Let’s dive into the metrics that really move the needle for your wallet. It’s time to demystify the numbers that shape our daily lives.

Inflation and Interest Rates: The Two Heavyweights
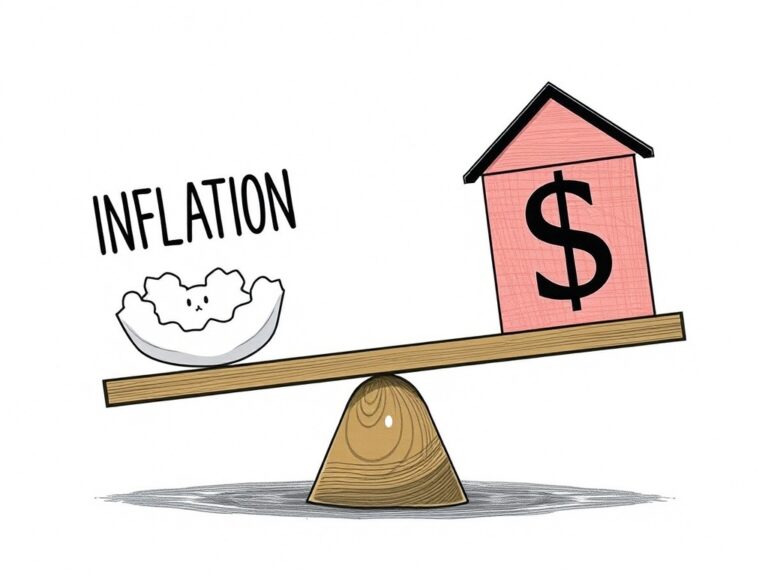
If you’ve noticed your grocery bill climbing lately, you’re already intimately familiar with inflation, the silent thief of purchasing power. Central banks, like the Federal Reserve, use interest rates as a lever to manage this, effectively pressing the gas or the brakes on economic growth.
- When rates go up, borrowing becomes expensive, which cools down spending.
- When rates go down, money flows freely, encouraging businesses and individuals to invest.
This back-and-forth dance is designed to keep the economy from spinning out of control. Many people view these changes as purely academic, but they have a direct impact on your mortgage, credit cards, and savings accounts. When interest rates hike, your bank might finally offer better interest on your savings, but your loan payments might also climb. Monitoring these two indicators is arguably the most effective way to gauge the direction of the market. It’s a balancing act that aims for long-term stability rather than short-term gains. By keeping an eye on these, you can anticipate shifts before they show up in your monthly statements. Stay informed, and you’ll always be one step ahead of the curve.
The Job Market: Your Personal Barometer
The unemployment rate is more than just a number; it represents the heartbeat of consumer confidence and spending power. When more people are gainfully employed, they have more disposable income to put back into the economy, which fuels business growth and innovation. Conversely, a spike in unemployment can trigger a chain reaction that often leads to a slowdown in retail, housing, and luxury sectors. Experts pay close attention to non-farm payroll reports because they provide a real-time snapshot of how many people are actually working. Think of it this way: if your neighbors are all working, they are buying cars, groceries, and services, which keeps the local economy humming along nicely. When you read the news, don’t just skim past the job numbers; consider what they mean for the general optimism of the public. Low unemployment typically signals a healthy, expanding economy where businesses are hungry for talent. On the other hand, rising joblessness is a red flag that businesses are tightening their belts. Keeping tabs on the labor market provides a human-centered view of the cold, hard data we usually see in finance. It is arguably the most relatable indicator of all.
Consumer Confidence: The Ultimate Predictor
Last but certainly not least is the Consumer Confidence Index, which measures how optimistic or pessimistic people feel about their personal financial situation. This is essentially a vibe check on the entire economy, and surprisingly, it is often a leading indicator of what is to come next. When consumers feel good, they spend freely; when they feel anxious, they save and hoard their cash, causing a contraction.
- Optimism leads to higher spending on big-ticket items like homes and cars.
- Pessimism usually results in a ‘wait-and-see’ approach that stalls market momentum.
Since consumer spending accounts for a huge chunk of total economic output, understanding this sentiment is a powerful tool for any investor. It’s about psychology as much as it is about mathematics. When you feel confident, you might splurge on a vacation or upgrade your tech, and you are not alone in that behavior. Investors use this index to predict future growth and adjust their portfolios accordingly before the broad market catches on. Don’t underestimate the power of the crowd’s collective mood when making your own financial plans. By paying attention to how people are feeling about their finances, you gain insight into the economy’s future path. It really is that simple: when people believe, they spend, and the market thrives.