Market Movements and Economic Indicators: A Plain English Guide to Understanding the Economy
Ever wondered why the stock market suddenly takes a wild rollercoaster ride because of a single government report? It is easy to feel overwhelmed by financial jargon, but understanding market movements and economic indicators is actually like learning to read the weather report before heading outside. Essentially, these indicators are just vital signs—think of them as the pulse, blood pressure, and temperature of our financial ecosystem. When you learn how to interpret these signs, you transition from a confused spectator to an active, informed participant who can make smart financial decisions. This plain English guide is designed to demystify the complex web of market forces and show you how everything connects. Whether you are saving for retirement, managing a small business, or just curious about why prices keep rising, this knowledge is your ultimate superpower. Let’s break down the noise into actionable, easy-to-digest insights that will help you navigate the financial world with absolute confidence. Throughout this journey, we will explore key concepts using simple analogies and real-world examples that bring dry numbers to life. Remember, you do not need a Ph.D. in finance to understand how money flows; you just need to know which signals to watch. By the end of this guide, you will look at financial news headlines through a completely new, empowering lens. So, let’s dive right in and unpack the primary driving forces behind global market movements together!
📊 Gross Domestic Product: The Ultimate Economic Scorecard
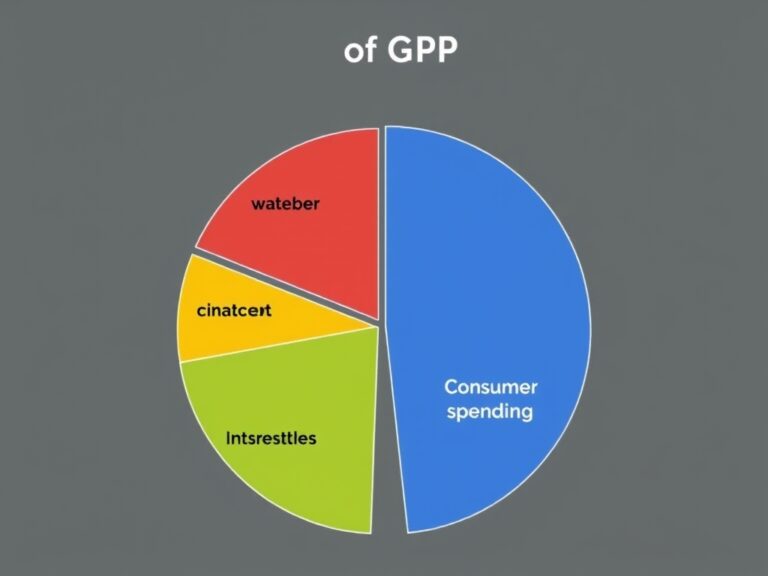
First up is the heavyweight champion of economic data: Gross Domestic Product (GDP). Think of GDP as the report card of a nation’s entire economy, measuring the total dollar value of all goods and services produced over a specific period. When the GDP is growing at a healthy clip, usually around 2% to 3% annually, businesses are expanding, jobs are plentiful, and consumer confidence is high. However, if the GDP shrinks for two consecutive quarters, economists officially sound the alarm for a recession. Why does this matter to you and your investment portfolio? Well, strong GDP growth generally drives corporate profits higher, which in turn propels stock prices upward. To keep it simple, here is what makes up the GDP formula:
- Consumer Spending (C): What you and I spend on groceries, cars, and haircuts.
- Business Investment (I): Money spent on factories, software, and machinery.
- Government Spending (G): Infrastructure, defense, and public services.
- Net Exports (X – M): Selling more goods abroad than we import.
When consumers feel secure, they spend more, driving up the “C” component, which accounts for nearly 70% of the U.S. economy. Conversely, when uncertainty hits, people tighten their purse strings, causing a ripple effect that slows down the entire system. By keeping an eye on GDP trends, you can easily gauge whether the economic engine is firing on all cylinders or starting to sputter. It is the ultimate baseline indicator that sets the stage for all other market dynamics we observe daily. Understanding this scorecard helps you anticipate major market shifts before they catch the average investor completely off guard.
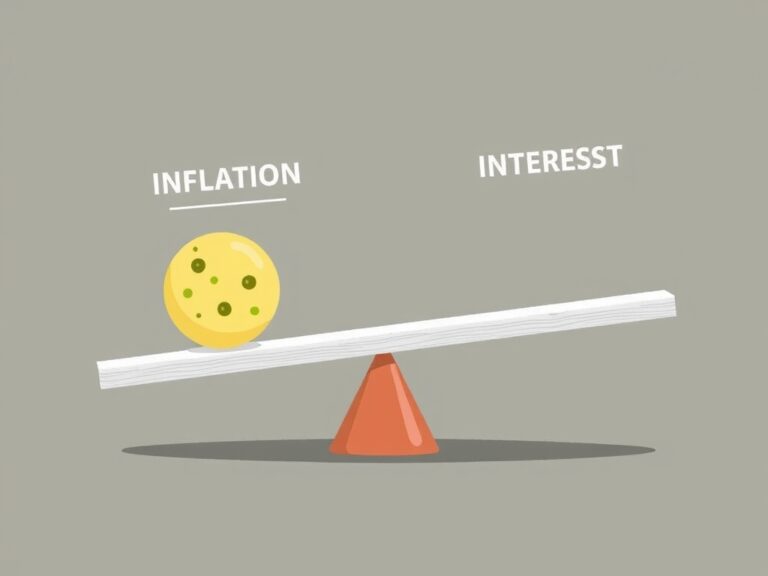
🔥 Inflation and Interest Rates: The Ultimate Financial Tug-of-War
Now, let’s talk about the two forces that directly impact your wallet every single day: inflation and interest rates. Inflation is simply the rate at which the general level of prices for goods and services is rising, eroding your purchasing power over time. To measure this, economists track the Consumer Price Index (CPI), which acts like a basket of goods that a typical household buys. When inflation gets too high, central banks like the Federal Reserve step in to cool things down by raising interest rates. Think of interest rates as the “cost of borrowing money” or the price of credit. When the Fed hikes rates, borrowing becomes more expensive for homes, cars, and business loans, which naturally slows down spending. This creates a delicate balancing act that central banks must manage perfectly:
- Low Interest Rates: Encourage borrowing, spending, and stock market growth, but risk fueling high inflation.
- High Interest Rates: Tame rampant inflation, but risk slowing down the economy so much that they trigger a recession.
As an investor, you must watch this tug-of-war closely because it dictates which assets perform best. For example, growth stocks tend to struggle when interest rates rise because future cash flows are worth less today. On the flip side, cash and fixed-income assets like bonds often become more attractive during high-rate environments. This continuous cycle of adjusting rates is the primary tool used to keep our economic ship sailing smoothly. By understanding this relationship, you can adjust your portfolio to weather whatever interest rate climate lies ahead. It is all about finding the sweet spot where growth can flourish without causing prices to spiral out of control.
💼 Employment Reports and Consumer Sentiment: The Human Element
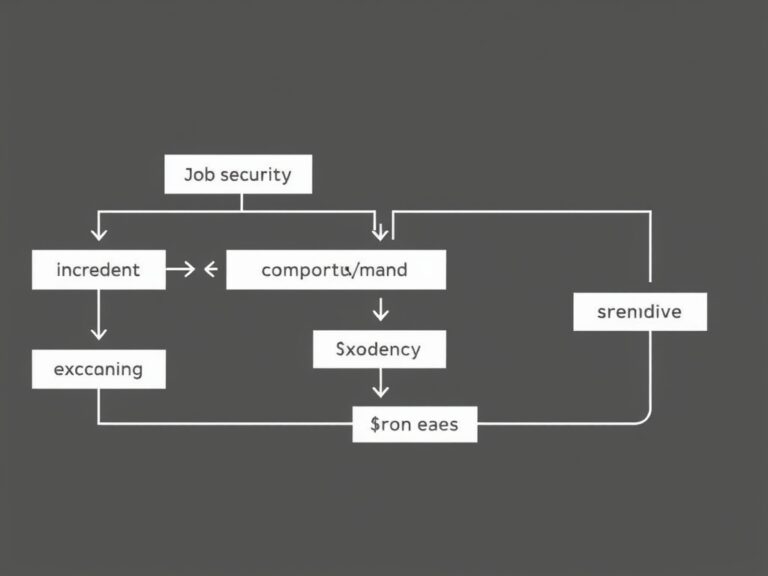
Beyond raw financial data, the economy is driven by real people, making employment reports and consumer sentiment incredibly critical indicators. The most anticipated economic release every month is the Non-Farm Payrolls (NFP) report, which shows how many jobs were created. A low unemployment rate indicates a strong job market where workers have leverage, leading to higher wages and more robust spending. However, a job market that is too tight can actually cause concern for inflation, as companies raise prices to cover rising labor costs. This is where the human element truly shines, as consumer confidence directly dictates how money flows through the economy. Let’s look at the cycle of how employment shapes our daily financial realities:
- High Employment: Steady paychecks lead to high consumer confidence and increased retail spending.
- Rising Unemployment: Fearing job losses, consumers cut back on discretionary spending and save more.
- Business Reaction: Decreased consumer demand forces businesses to reduce production and freeze hiring.
When consumer sentiment surveys show that people are optimistic about the future, they are much more likely to make big purchases like houses or vacations. This optimistic behavior acts as a powerful catalyst, driving economic expansion and boosting stock market valuations. Conversely, a drop in confidence is often a leading indicator of an impending economic slowdown, even before the hard data shows it. Investors closely monitor indicators like the Michigan Consumer Sentiment Index to get a real-time pulse on consumer behavior. Ultimately, businesses cannot thrive if their customers are unwilling or unable to spend money. Seeing these connections helps you understand why stocks often react positively to mild job losses—it indicates a cooling economy and potentially lower rates.
🎯 Putting It All Together: Your Roadmap to Savvy Investing
Now that you know how GDP, inflation, interest rates, and employment interact, how do you use this knowledge to build a resilient financial strategy? The key is not trying to predict the future with 100% accuracy, but rather preparing your portfolio for different economic seasons. Successful investing involves understanding which phase of the business cycle we are currently in and diversifying your assets accordingly. During periods of high growth, you might want to focus on equities, technology, and real estate to capture maximum upside. Conversely, when economic indicators signal a slowdown, shifting toward defensive sectors like utilities, healthcare, and consumer staples can protect your capital. Here are three simple, actionable steps to start applying these insights today:
- Watch the Trends: Focus on the direction of indicators (e.g., is inflation cooling down?) rather than just single data points.
- Stay Diversified: Never put all your eggs in one basket, as different assets react differently to economic shifts.
- Filter the Noise: Block out daily sensationalist headlines and focus on long-term macroeconomic fundamentals.
Remember, even the most seasoned Wall Street experts cannot perfectly time market movements, so patience remains your greatest asset. By focusing on high-quality assets and maintaining a long-term perspective, you can easily ride out short-term market volatility. Economic indicators should serve as a compass to guide your direction, not a crystal ball to make reckless short-term bets. Armed with this plain English guide, you are now fully equipped to make smarter, more informed decisions for your financial future. Keep learning, stay curious, and watch how your confidence grows as the complex world of finance finally starts making perfect sense.