Understanding Market Movements: A Plain English Guide to Economic Indicators
Have you ever wondered why the stock market suddenly takes a wild rollercoaster ride after a seemingly boring government report is released? Welcome to the fascinating world of economic indicators, the vital signs of our financial system that professional traders and smart investors watch like hawks. Think of these indicators as a GPS for your investment journey; without them, you are essentially driving blindfolded through a landscape of volatile market movements. In this plain English guide, we are going to demystify these complex-sounding reports and turn them into actionable insights you can actually use. Market movements are never completely random, although they can certainly feel that way when your portfolio is fluctuating daily. Instead, they are driven by the collective reactions of millions of participants analyzing real-world economic data. Understanding how to read these signals allows you to anticipate shifts rather than just reacting to them after the damage is already done. Whether you are a long-term investor or a curious beginner, learning to decode this financial weather forecast is your ticket to building real confidence. By looking at key metrics like GDP, inflation, and employment figures, we can begin to see the big picture clearly. So, let’s grab a cup of coffee and break down how these massive global forces influence your personal wallet in a simple, straightforward way. Ready to transform from a confused spectator into an informed market observer? Let’s dive right into the core metrics that dictate the rhythm of Wall Street!
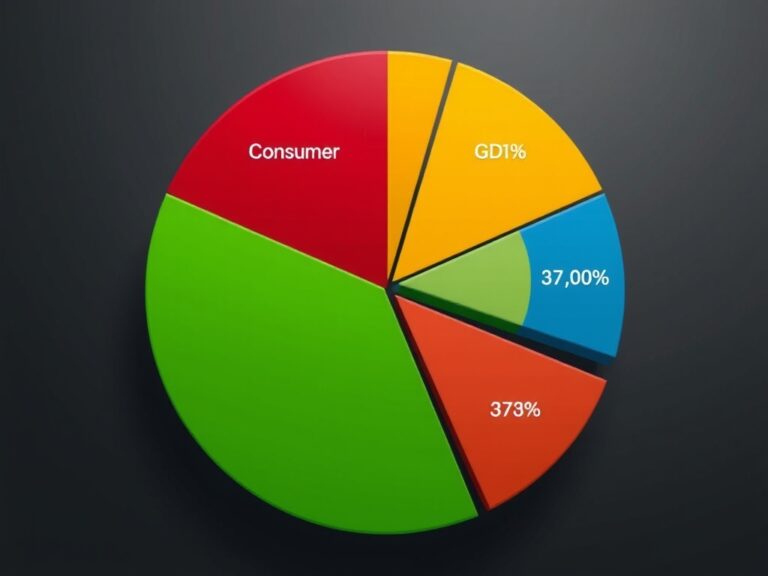
To truly understand economic health, we must start with the granddaddy of all financial metrics: Gross Domestic Product (GDP). Simply put, GDP represents the total dollar value of all goods and services produced within a country’s borders over a specific period, usually a quarter or a year. It acts as the ultimate economic scorecard, telling us whether the entire machine is expanding, stalling, or shrinking. When GDP is growing at a healthy pace of around 2% to 3%, businesses are thriving, consumers are spending, and the stock market generally enjoys a bullish run. However, if GDP growth accelerates too quickly, it can trigger fears of an overheated economy, leading to potential interest rate hikes. Conversely, consecutive quarters of negative GDP growth signal a recession, which typically causes stock prices to tumble as corporate profits dry up. To make sense of GDP, we can break it down into four main engines that drive the entire ship:
- Consumer Spending: The lifeblood of the economy, representing about 70% of total economic activity.
- Business Investment: Money spent by companies on equipment, technology, and expansion.
- Government Spending: Infrastructure projects, defense, and public services that inject cash into the system.
- Net Exports: The value of exports minus imports, showing our trade balance with the rest of the world.
When you monitor these individual engines, you can easily spot which parts of the economy are firing on all cylinders and which ones are sputtering. For instance, strong retail sales reports often forecast a robust GDP print, giving smart investors a valuable head start. Keeping a close eye on these quarterly reports is crucial because they set the baseline expectation for corporate earnings and overall market sentiment. In short, if GDP is the heart of the economy, then understanding it is the key to predicting major market cycles.
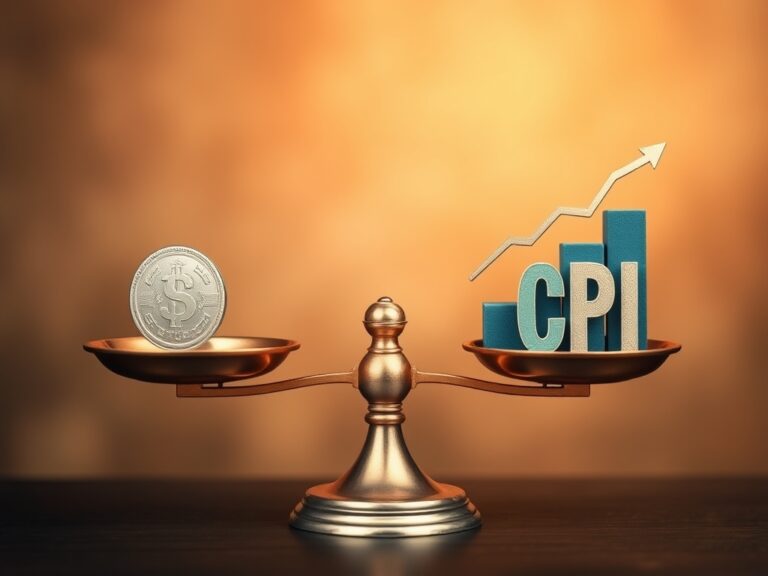
Next up on our radar is the double-edged sword known as inflation, which is the general rise in prices and the subsequent decline in purchasing power. While a little bit of inflation is actually a sign of a healthy, growing economy, too much of it can erode your hard-earned savings like acid. To measure this silent wealth destroyer, economists rely heavily on the Consumer Price Index (CPI), which tracks the monthly price changes of a basket of common household goods and services. When CPI numbers come in higher than expected, it sends shockwaves through the financial markets because of how central banks react. To cool down runaway inflation, the Federal Reserve will raise interest rates, making borrowing money more expensive for both businesses and consumers. This sudden increase in borrowing costs slows down economic growth, reduces corporate profits, and often leads to a drop in stock prices. On the flip side, lower-than-expected CPI data can spark a massive market rally as investors anticipate a more relaxed, business-friendly interest rate environment. Understanding inflation is absolutely critical because it directly influences your purchasing power and the valuation of your investments. To protect your portfolio from being eaten away by rising prices, you need to know how different asset classes react to CPI shifts:
- Equities: High inflation can hurt growth stocks as their future cash flows become less valuable in today’s dollars.
- Bonds: Fixed-income investments suffer because their set interest payments buy fewer goods in a high-priced world.
- Hard Assets: Commodities like gold and real estate often act as natural hedges, rising in value alongside inflation.
By keeping a vigilant eye on monthly CPI releases, you can actively rebalance your portfolio to weather any inflationary storm that comes your way. Ultimately, inflation dictates the cost of money itself, making CPI one of the most powerful market-moving indicators in existence.
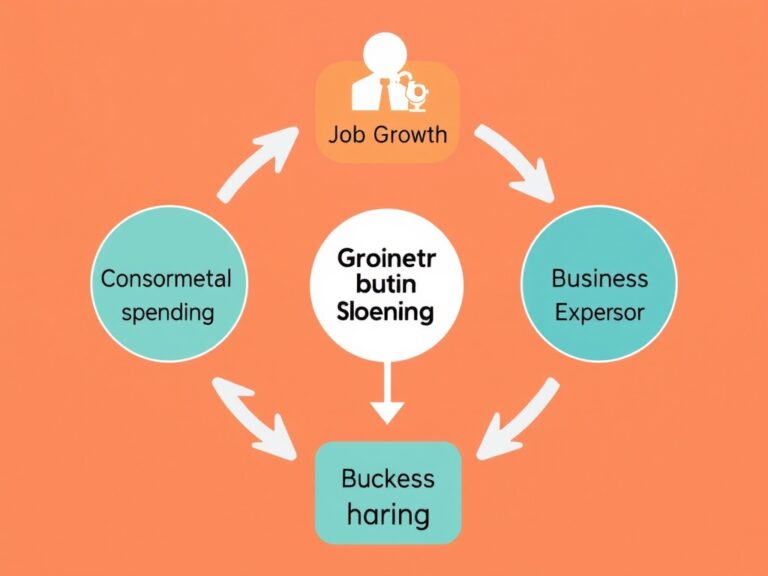
Have you ever wondered what fuels the massive consumer spending engine we discussed earlier in our GDP section? The answer is simple: steady jobs, which is why employment reports are considered high-octane fuel for market movements. Every first Friday of the month, the U.S. Bureau of Labor Statistics drops a bombshell report known as the Non-Farm Payrolls (NFP). This highly anticipated report details the number of new jobs created in the previous month, excluding agricultural workers, government employees, and private household staff. Alongside NFP, we also get the official unemployment rate, which measures the percentage of the labor force actively seeking work but unable to find it. A robust jobs report with high employment is generally a green light for the stock market, as it means more people have paychecks to spend on goods and services. However, there is a catch: an exceptionally tight job market can lead to wage-push inflation, forcing the central bank to hike interest rates to prevent overheating. Conversely, weak employment numbers signal economic trouble ahead, raising fears of a recession and causing stock markets to slide. To understand how employment drives market cycles, let’s look at the classic feedback loop:
- Job Growth: Leads to higher consumer confidence and increased disposable income.
- Consumer Spending: Increases corporate revenues, driving up corporate stock prices.
- Business Expansion: Encourages companies to hire even more workers, continuing the positive cycle.
By monitoring these monthly employment figures, you can easily gauge the strength of the consumer base before it reflects in retail sales and GDP. This proactive approach turns complex labor statistics into a clear roadmap for your future investment decisions.
Now that we have explored GDP, inflation, and employment, we must look at the ultimate puppet master directing all market movements: interest rates set by central banks. The Federal Reserve, or the Fed, acts as the financial referee, adjusting the cost of borrowing money to keep the economy balanced. When the Fed cuts interest rates, it is trying to stimulate a sluggish economy by making it cheap for businesses to expand and consumers to borrow. This environment of easy money is incredibly bullish for the stock market, as low rates push investors out of low-yield bonds and into equities. Conversely, when the Fed raises interest rates to combat inflation, it effectively puts a brake on the economic engine, making borrowing much more expensive. This tightening of monetary policy often triggers market corrections as investors adjust to lower corporate earnings and higher bond yields. As the famous Wall Street saying goes, Don’t fight the Fed, because the central bank’s policy direction is the single most powerful force in finance. To navigate these policy shifts successfully, you should focus on these critical indicators of central bank health:
- Federal Funds Rate: The benchmark interest rate that influences all other borrowing rates across the economy.
- FOMC Meeting Minutes: Released weeks after meetings, providing vital clues about future monetary policy directions.
- Yield Curve: A graph plotting interest rates of bonds with different maturities, often acting as a recession predictor.
By understanding how the Fed digests economic data, you can anticipate policy shifts before they are officially announced. This macro-level understanding transforms market volatility from a source of stress into a goldmine of investment opportunities. With these tools in your financial toolkit, you are now fully equipped to decode market movements and invest with professional-grade clarity and confidence.