Market Movements Explained: A Simple Guide to Today’s Economic Indicators
⚓️ Navigating the Market Waves
Have you ever stared at a stock chart and wondered why the numbers suddenly spike or plunge without warning? To the untrained eye, the financial markets can look like a chaotic storm of random numbers and flashing green and red lights. However, behind every major market movement lies a set of powerful forces known as economic indicators. These indicators are essentially the report cards of the global economy, released regularly by government agencies and private organizations. Understanding these reports is like having a reliable weather forecast in a stormy sea; it helps you anticipate trends rather than just react to them. When you learn to read these signs, you transition from being a passive observer to an informed participant who can make strategic decisions. In this simple guide, we will demystify the key economic metrics that drive today’s market trends, breaking down complex data into actionable insights. By focusing on what truly matters, we can cut through the daily noise of Wall Street and find the underlying narrative of growth or contraction. Why does this matter to you? Because whether you are a seasoned investor, a small business owner, or someone planning for retirement, these movements directly impact your purchasing power and investment returns. Let’s embark on this journey to decode the market’s secret language and empower your financial future. Together, we will explore the major indicators that institutional traders watch every single day to shift billions of dollars around the globe.
📈 Gross Domestic Product (GDP): The Ultimate Economic Scorecard
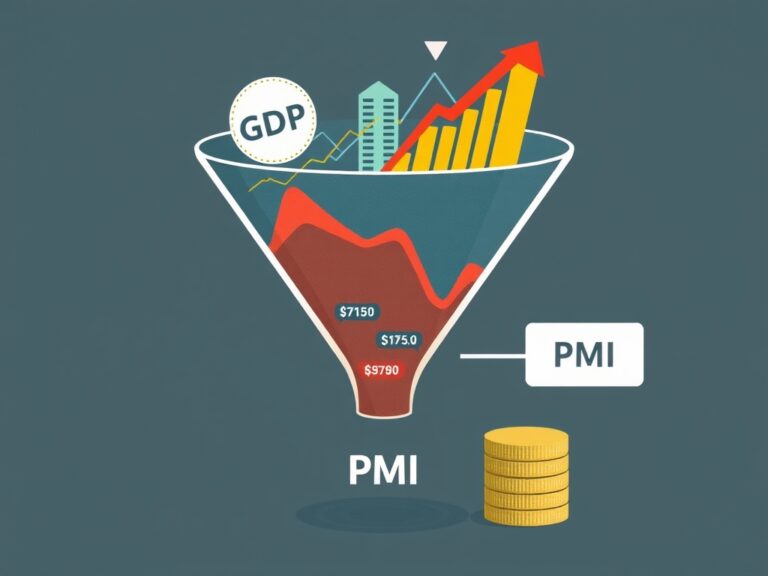
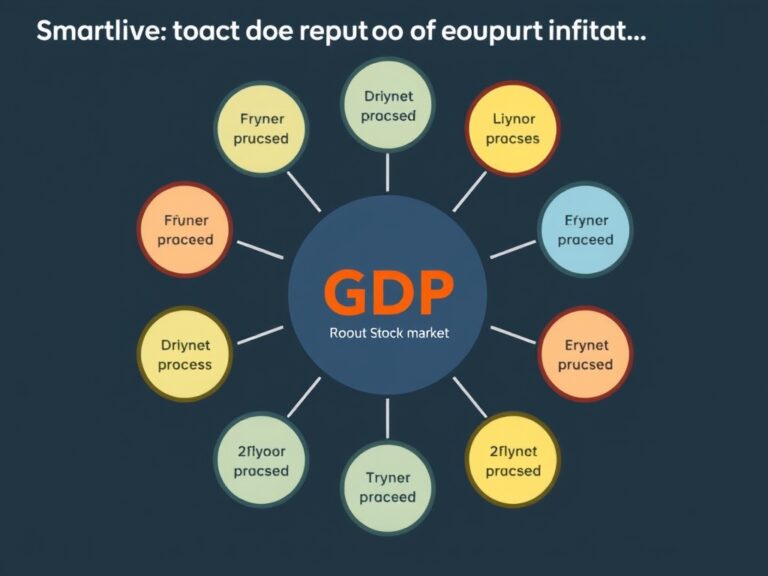
First and foremost, we must examine the heavyweight champion of economic data: Gross Domestic Product (GDP). In simple terms, GDP represents the total monetary value of all finished goods and services produced within a country’s borders over a specific period. When the GDP is growing robustly, it indicates a healthy, expanding economy where businesses are thriving and consumers are spending money. Conversely, a shrinking GDP over two consecutive quarters officially signals a recession, which often triggers widespread market sell-offs. Investors monitor GDP growth rates closely because they directly correlate with corporate earnings potential and overall stock market performance. These economic pillars include the following key areas:
- Consumer Spending (individual purchases)
- Business Investment (corporate spending)
- Government Expenditures (public spending)
- Net Exports (trade balance)
When the GDP report exceeds analyst expectations, we typically see a bullish surge in the stock market as optimism spreads. On the flip side, a weaker-than-expected GDP reading can cause bond yields to drop and stock prices to tumble as fears of contraction rise. It is important to remember that GDP is a lagging indicator, meaning it tells us what has already happened rather than what will happen next. Despite this lag, it remains the primary benchmark that policymakers use to adjust fiscal policies and interest rates. By understanding GDP trends, you can position your portfolio to ride the waves of economic expansion or adopt defensive positioning. Ultimately, monitoring this metric ensures you are never blindsided by the broader macroeconomic cycle.
💼 Employment Reports: The Pulse of Consumer Power
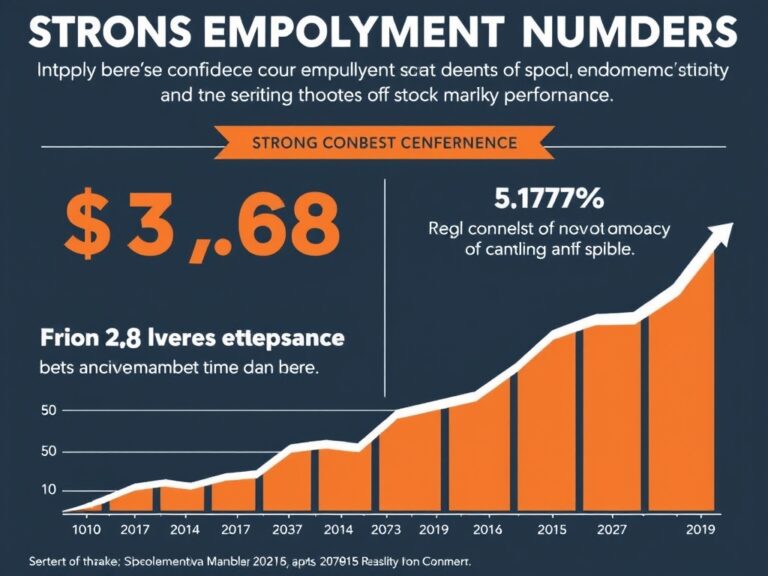
Next up, we must examine the heartbeat of the economy: the monthly employment reports, particularly the Non-Farm Payrolls (NFP) in the United States. This indicator measures the number of new jobs created during the previous month, excluding farm workers, government employees, and non-profit workers. A strong labor market is the ultimate catalyst for consumer spending, which as we established, makes up the largest chunk of economic activity. When people are gainfully employed and wages are rising, they have more disposable income to spend on houses, cars, technology, and dining out. Conversely, high unemployment rates and job losses lead to cautious spending, causing corporate revenues to drop and stock prices to slide. For this reason, the monthly NFP release on the first Friday of every month is one of the most volatile events on the financial calendar. During these announcements, traders and algorithms scan the data instantly, looking for three critical figures:
- 📈 Non-Farm Payrolls: The net change in jobs created.
- 📉 Unemployment Rate: The percentage of the labor force currently without a job.
- 💰 Average Hourly Earnings: A key measure of wage inflation.
If job growth is too strong, it can paradoxically scare investors because it might force central banks to raise interest rates to cool down the economy. On the other hand, if job growth is too weak, it signals economic weakness, which also spooks markets. Finding the “Goldilocks” zone—where job growth is steady but not inflationary—is the ideal scenario for stock market growth. Therefore, understanding the health of the labor market gives you a direct window into future consumer demand. By keeping an eye on these monthly reports, you can anticipate shifts in consumer discretionary stocks and broader market sentiment.
⚖️ Inflation and Interest Rates: The Financial Tug of War
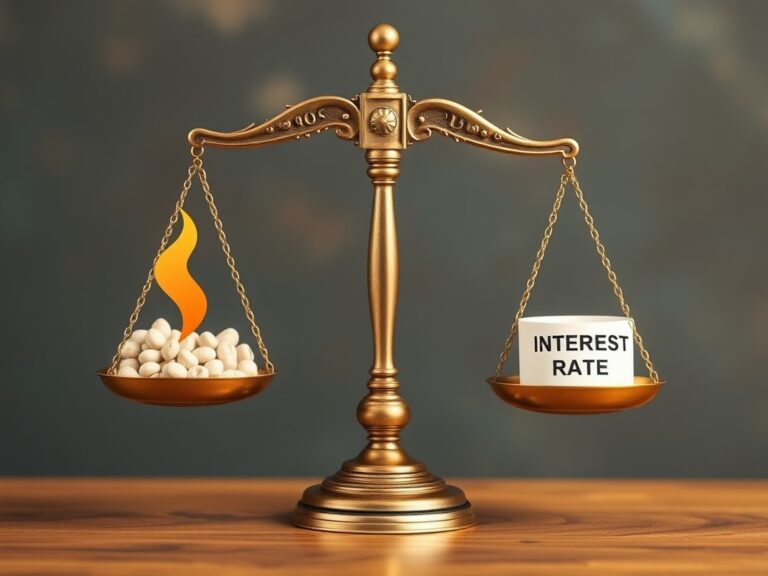
Now let’s dive into the powerful financial tug-of-war between inflation and interest rates, which currently dominates daily financial headlines. Inflation is the rate at which the general level of prices for goods and services is rising, eroding your purchasing power over time. To measure this, economists rely on the Consumer Price Index (CPI) and the Producer Price Index (PPI) to track price changes at the consumer and wholesale levels. When inflation runs too hot, central banks like the Federal Reserve must step in and raise their benchmark interest rates. Raising interest rates is designed to cool down the economy by making borrowing money more expensive for both consumers and corporations. As a direct result, mortgage rates climb, credit card debt becomes costlier, and businesses scale back on expansion plans. Conversely, when inflation is low and the economy is sluggish, central banks will lower interest rates to encourage borrowing, spending, and investment. This dynamic is crucial for stock market valuations because higher interest rates reduce the present value of future corporate cash flows. This is why technology and growth stocks, which rely heavily on future earnings, often suffer significantly when interest rates are rising. Meanwhile, value sectors like banking, energy, and utilities tend to perform relatively well or hold their value in a high-rate environment. Consequently, monitoring inflation data allows you to forecast how central banks will adjust monetary policy in the coming months. Mastering this relationship is the absolute key to protecting your portfolio from the erosive effects of inflation and interest rate shocks.
🎯 Sentiment and Leading Indicators: Peering into the Future
While indicators like GDP and employment tell us where the economy has been, we also need tools to see where it is going. This is where leading indicators and sentiment surveys come into play, serving as the headlights of our economic vehicle. One of the most influential leading indicators is the Purchasing Managers’ Index (PMI), which surveys supply chain executives on future business conditions. A PMI reading above 50 signals expansion in the manufacturing or service sectors, while a reading below 50 indicates contraction. Similarly, consumer sentiment indexes measure how optimistic or pessimistic everyday people feel about their personal finances and the overall economy. Since consumer spending drives the economy, high confidence levels usually predict increased spending and stronger corporate earnings in the months ahead. Conversely, a sharp drop in consumer confidence can serve as an early warning sign that a recession or slowdown is approaching. By combining these forward-looking leading indicators with lagging indicators like GDP, you get a complete, multi-dimensional view of the economic landscape. Here are three quick tips to integrate these insights into your investing strategy:
- 🎯 Look for Divergences: Note when stock prices rise but leading economic indicators begin to trend downward.
- ⚖️ Balance Your Portfolio: Diversify between defensive sectors and growth sectors based on where we are in the economic cycle.
- ⏳ Avoid Emotional Reactions: Focus on long-term structural trends rather than panic-selling during temporary, short-term volatility.
In conclusion, understanding these economic indicators transforms market movements from a chaotic guessing game into a logical, predictable sequence of patterns. As you continue to watch the news and monitor your investments, try to view every headline through the lens of these macroeconomic forces. With this simple guide in hand, you are now well-equipped to navigate today’s markets with confidence, clarity, and expert-level precision.