

Understanding Market Movements: A Plain-English Guide to Economic Indicators
Decoding the Pulse of the Global Economy
Have you ever wondered why the stock market takes a sudden nosedive or why your morning coffee suddenly feels a bit more expensive? Understanding market movements isn’t just for Wall Street insiders; it is a vital skill for anyone looking to navigate their personal finances with confidence. At its core, economic indicators are like the dashboard of a car, telling us whether the engine of the economy is humming along or starting to overheat. These data points—ranging from employment figures to consumer spending—provide us with a clear snapshot of current health and future prospects. Knowledge is power, and by learning to read these signals, you can move from reacting to market volatility to anticipating it. In this guide, we will break down the complex world of economic reports into simple, plain-English concepts. We will explore how these indicators influence investor sentiment and, ultimately, the price of your favorite assets. Let’s demystify these trends together and help you become a more informed participant in the global marketplace. Whether you are a seasoned investor or just starting, grasp these basics to stay ahead of the curve.

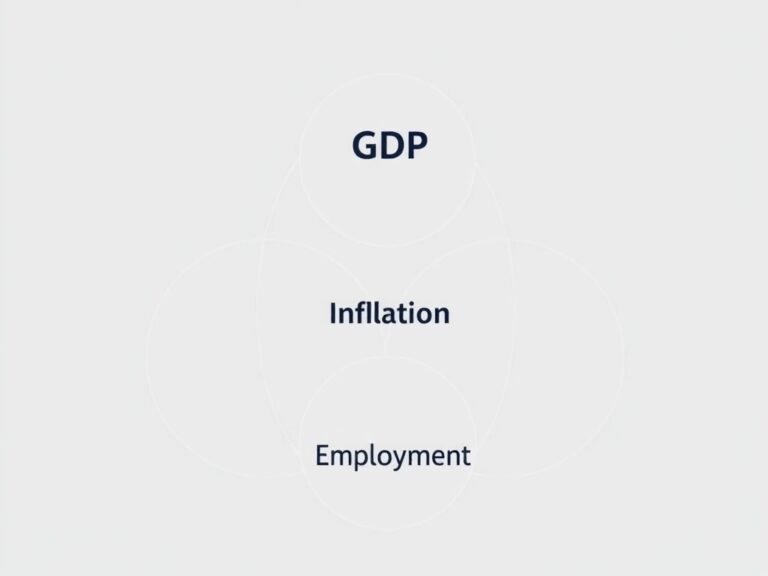
The Big Three: GDP, Inflation, and Employment
When economists talk about the economy, they almost always start with the ‘Big Three’ indicators: Gross Domestic Product (GDP), Consumer Price Index (CPI), and the Unemployment Rate. GDP serves as the ultimate scorecard, measuring the total value of all goods and services produced within a country’s borders during a specific period. If GDP is growing, it usually signifies a healthy, expanding economy where businesses are thriving and jobs are plentiful. On the flip side, we have inflation, which is measured by the CPI, tracking the change in the average price level of a basket of consumer goods.
- Moderate inflation can be a sign of a growing economy.
- Hyperinflation, however, erodes your purchasing power rapidly.
When prices rise too fast, the central bank often steps in to raise interest rates, which acts as a brake on the economy. Meanwhile, the unemployment rate acts as a direct measure of labor market health. Low unemployment suggests a tight labor market where workers have more bargaining power for higher wages. Monitoring these three metrics consistently will give you a solid foundation for evaluating broader market trends without getting lost in the noise of daily news cycles.
Leading vs. Lagging Indicators
Not all economic data is created equal, and understanding the difference between leading and lagging indicators is crucial for timing your decisions. Leading indicators are your crystal ball; they change before the economy as a whole changes, offering a glimpse into what might happen next. Common examples include stock market performance, building permits, and manufacturing orders, which react quickly to changes in business confidence. If businesses expect a downturn, they stop ordering parts and stop applying for building permits immediately. In contrast, lagging indicators confirm what has already occurred, providing a retrospective look at the cycle. Examples include the unemployment rate and interest rates, which often move only after significant shifts have already taken root in the economy. Why does this distinction matter for you? Because reacting to lagging indicators can sometimes mean you are already late to the party. By focusing on leading indicators, you can better position your portfolio to withstand upcoming volatility or take advantage of emerging opportunities. Always keep an eye on how these signals interact to form a more complete picture of the economic horizon.
Turning Data into Strategy
Now that you have a grasp of the key indicators, how do you actually turn this information into a smarter financial strategy? It starts with avoiding the urge to panic whenever you see a ‘negative’ report in the headlines. Markets are incredibly efficient at ‘pricing in’ information, meaning that by the time you hear about a shift, the market may have already adjusted. Instead of day-trading based on every single release, use these indicators to maintain a balanced long-term perspective. If you see signs of rising inflation and high interest rates, it might be time to review your debt levels or look for assets that traditionally perform well in high-rate environments. Conversely, in a cooling economy, focusing on stability and cash flow can be a wise defensive play.
- Stay informed by bookmarking reliable government economic calendars.
- Avoid impulsive reactions to short-term market noise.
- Diversify your holdings to mitigate the impact of sector-specific economic shifts.
Remember, the goal isn’t to predict the future with 100% accuracy, but to be prepared for various scenarios. By integrating these insights into your routine, you are transforming yourself from a passive observer into an active, strategic financial planner. Keep learning, stay curious, and keep your eye on the big picture to thrive in any market environment.