

Understanding Market Movements: A Plain-English Guide to Economic Indicators
Decoding the Pulse of the Global Economy
Have you ever wondered why stock markets swing wildly one day and remain eerily calm the next? It all boils down to economic indicators—the data points that act as a barometer for the financial health of our nation. Think of these indicators as a dashboard for a massive, complex machine called the economy, helping us predict where things are headed next. 📈 Whether you are a seasoned investor or just a curious observer, understanding how these metrics work is your golden ticket to navigating market movements with confidence. We are going to strip away the jargon and break down these complex reports into plain English that actually makes sense. By the end of this guide, you will be able to read headlines about GDP growth or inflation rates and immediately understand what they mean for your wallet. It is not just about dry numbers; it is about the stories those numbers tell regarding supply, demand, and consumer behavior. Let’s dive into the fascinating world of financial forecasting and learn how to read the signals hidden in plain sight. Mastering these basics won’t just make you smarter; it will help you make better financial decisions in a volatile market.
The Big Three: GDP, Inflation, and Unemployment
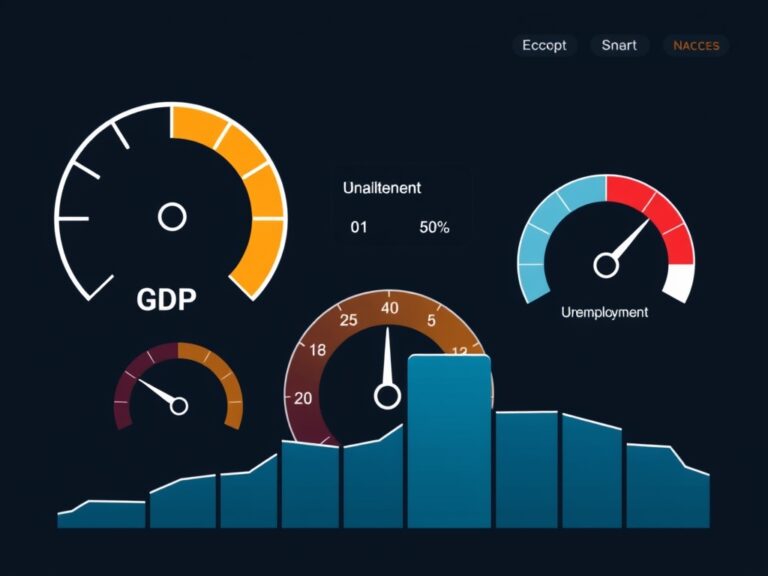
If there is a holy trinity of market analysis, it is definitely GDP (Gross Domestic Product), Inflation (CPI), and the Unemployment Rate. These three metrics are the primary pillars that economists look at when determining if a country is thriving or struggling.
- GDP tells us the total value of goods and services, essentially the economy’s ‘output speed.’
- Inflation (CPI) measures the rising cost of your morning coffee and groceries, showing us if our purchasing power is eroding.
- Unemployment acts as a proxy for consumer strength, as fewer jobs generally lead to less spending.
When these numbers deviate from expectations, the market reacts like a nervous teenager, jumping at every shadow. Market volatility often stems from a mismatch between expert forecasts and the actual reported numbers. For instance, if unemployment is lower than expected, the market might view it as a sign of a ‘hot’ economy, which could lead to interest rate hikes. Understanding this dance between expectations and reality is crucial for any reader trying to grasp macroeconomic trends. Each of these indicators provides a unique perspective that, when combined, creates a comprehensive picture of our financial reality.
Interest Rates and the Central Bank
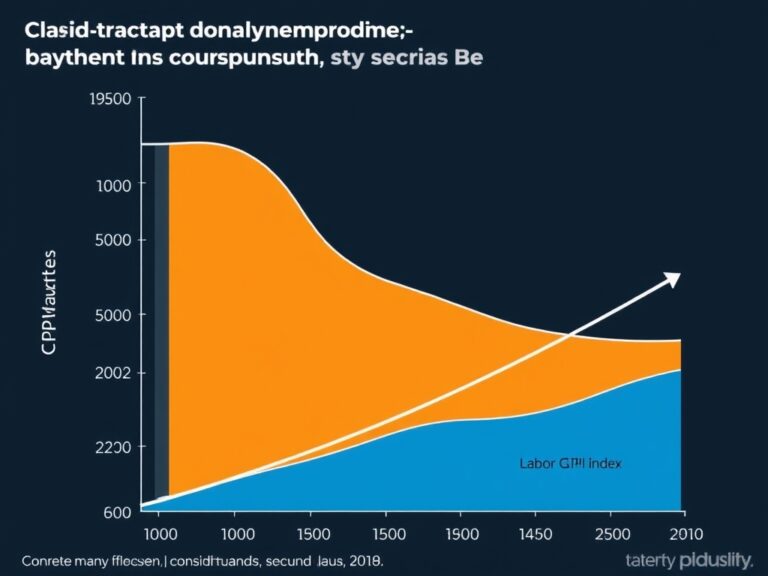
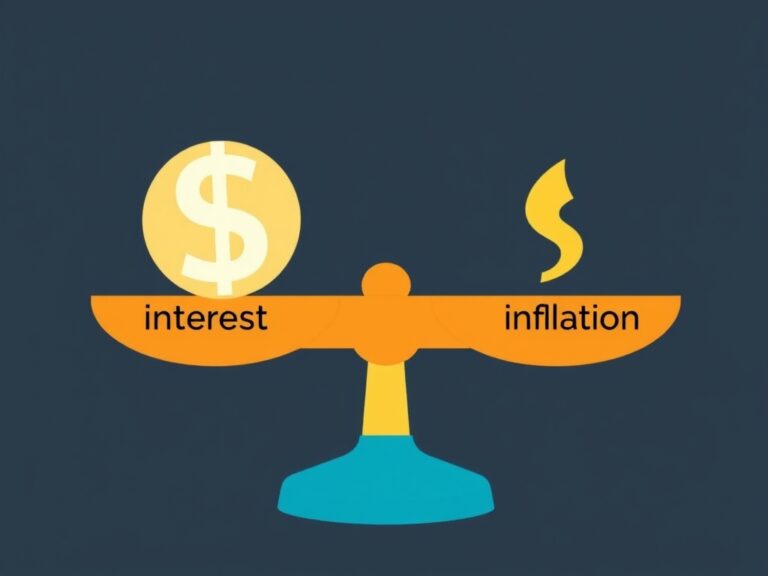
You have probably heard about the Federal Reserve and their mysterious ‘rate decisions’ that seem to shake the world. Interest rates are essentially the price of money; when they rise, borrowing becomes expensive, and when they fall, money flows freely through the system. 🏦 This ‘cost of capital’ influences everything from your mortgage rates to the expansion plans of your favorite tech companies. When the Fed raises rates to combat inflation, they are essentially hitting the brakes on economic growth to prevent the ‘car’ from overheating. Conversely, lowering rates is like pushing the gas pedal to encourage spending and investment during a slump. It is a delicate balancing act that requires a deep understanding of monetary policy and its lag effects. Investors watch these meetings with bated breath because even a small shift in language can send shockwaves through the stock and bond markets. By tracking central bank communications, you are staying ahead of the curve rather than just reacting to the aftermath. Remember, while the Fed might seem like an abstract entity, their decisions are the single most influential driver of medium-term market direction.
Putting It All Together: Becoming a Savvy Reader
Now that you have the basic toolkit, how do you synthesize all this information into a cohesive strategy? Start by bookmarking reliable economic calendars that track these releases so you are never blindsided by a major data drop. 🗓️ Remember that markets are forward-looking, meaning they often ‘price in’ expected news well before the official report even hits the wires. This is why market sentiment can sometimes be more important than the actual data itself—it reflects what the ‘crowd’ believes will happen next. Stay humble, keep your focus on long-term trends rather than daily noise, and always look at the broader context of the global economy. Diversification is your best friend when indicators start flashing red, as it helps buffer your portfolio against sudden shifts. Financial literacy is a journey, not a destination, so keep questioning, reading, and learning. You don’t need a degree in finance to understand the forces moving your investments; you just need to keep your eyes open and your mind sharp. By following these principles, you are well on your way to becoming a more informed participant in the global financial ecosystem. Go forth and observe the market with a brand new lens that turns confusion into clarity and opportunity.