
Market Trends Explained: A Plain-English Guide to Economic Indicators
Understanding the Pulse of the Global Economy
Have you ever wondered why the stock market takes a nose-dive or why prices at the grocery store suddenly jump overnight? It’s not just random chaos; it’s all tied to economic indicators, the vital signs of our financial world. Think of these indicators as a check-up for the economy, helping us predict where things are headed next. Whether you are an investor, a small business owner, or just curious about your wallet, understanding these trends is a superpower. By learning to interpret data like inflation, employment rates, and GDP, you move from feeling confused to feeling empowered. Let’s strip away the complex jargon and look at how the real world functions behind the numbers. In this guide, we will break down the essential metrics that move markets and affect your personal finances daily. Ready to stop guessing and start knowing? Let’s dive into the plain-English breakdown of economic indicators that truly matter.

GDP: The Total Scoreboard of Economic Health
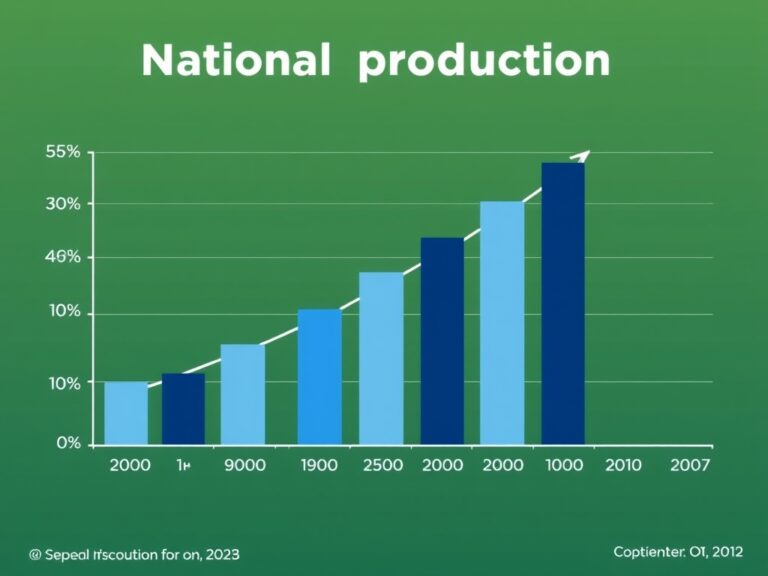
The Gross Domestic Product (GDP) is essentially the total scoreboard for a nation’s economic output. When you hear experts talking about growth, they are almost always referring to GDP, which measures the value of all goods and services produced. Think of it as the total income of a country’s kitchen—if the kitchen is producing more, the country is likely thriving. However, a high GDP isn’t the only metric that matters, as it doesn’t account for how that wealth is distributed. When GDP grows, it usually signals business expansion, more jobs, and increased consumer spending across the board. Conversely, two consecutive quarters of declining GDP indicate a recession, which can feel like a cold breeze on the market. Understanding this metric helps you spot the difference between a minor dip and a genuine economic shift.
- High GDP: Indicates a robust, growing economy.
- Low GDP: Suggests potential stagnation or recession.
- GDP Growth: Often leads to increased investor confidence and market gains.
It is the foundation upon which almost all other economic analysis is built, making it the primary indicator for long-term planning.
The Impact of Inflation and the CPI
If GDP is the speed of the economy, Inflation is the temperature. We measure inflation primarily through the Consumer Price Index (CPI), which tracks the average change over time in prices paid by consumers for a ‘basket’ of goods and services. When inflation is too high, your money loses purchasing power, meaning your hard-earned dollar buys less milk, gas, or rent than it did last year. On the flip side, mild inflation is actually seen as a sign of a healthy, growing economy, encouraging people to spend rather than hoard cash. Central banks often try to keep inflation around a 2% target to maintain stability without stifling growth. When you see headlines about the ‘cost of living crisis,’ you are looking at an inflation story unfolding in real-time. It is essential to understand that inflation is not always bad; it is about the pace and sustainability of price changes. Keeping an eye on these reports helps you make smarter decisions about saving, investing, and planning for your future budget.
- Stable Inflation: Essential for predictable financial planning.
- Hyperinflation: A dangerous rapid rise in costs.
- Deflation: Can lead to decreased spending and economic stalls.
Employment Data: The Human Side of the Market
Finally, we have the unemployment rate, which is perhaps the most personal economic indicator of all. This statistic measures the percentage of the labor force that is jobless and actively looking for work, reflecting the overall health of the workforce. When employment is high, consumer confidence typically soars because people have the disposable income to spend on experiences and products. If the job market is tight, businesses often have to raise wages to attract talent, which can sometimes lead to further price inflation. Investors watch these reports, such as the monthly Non-Farm Payrolls, to gauge whether the economy is creating or shedding jobs. It is not just about the number of people working, but also the quality of those jobs and the growth in average hourly earnings. By paying attention to these reports, you get a clear signal on whether companies are feeling confident enough to hire or cautious enough to freeze recruitment. Ultimately, labor market strength is the most consistent indicator of sustained economic growth. Stay informed, keep watching the data, and you will navigate the financial world with much more confidence.