
Market Trends Explained: A Plain-English Guide to Economic Indicators
Understanding the Pulse of the Global Economy
Have you ever wondered why stock markets swing wildly based on a single news report, or why your grocery bill seems to climb despite your best efforts at budgeting? Welcome to the fascinating world of economic indicators, the essential signals that tell us how the financial world is spinning. Think of these indicators as the dashboard of your car; they provide real-time data on speed, fuel, and engine health so you can navigate the road ahead. Whether you are a seasoned investor or just someone trying to make sense of the nightly news, understanding these trends is your secret weapon. In this guide, we will break down the complex jargon into plain-English concepts that you can actually use. We will explore everything from inflation to unemployment rates, stripping away the mystery that often clouds financial reporting. By the end of this journey, you will look at market reports not as intimidating puzzles, but as clear stories about our collective prosperity. Let’s dive into how these signals shape your wallet and your future. Ready to decode the signals? Let’s get started with the basics of what makes the economy tick.
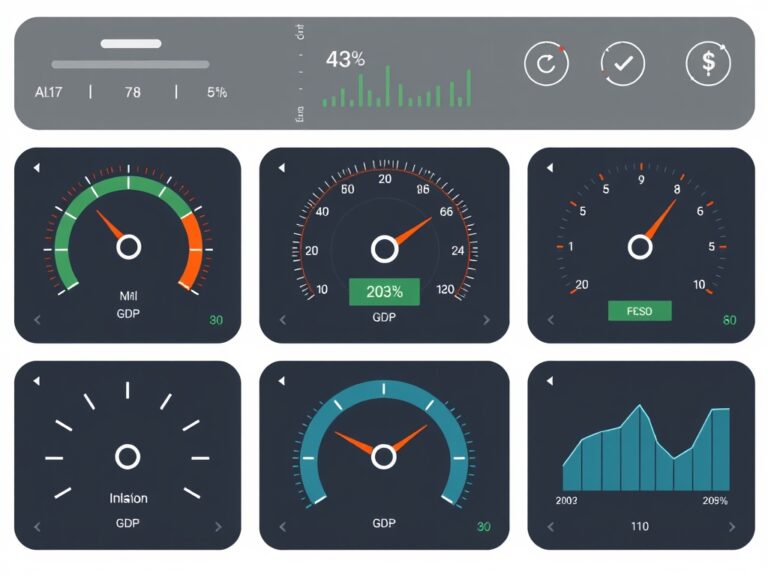
The Big Three: GDP, Inflation, and Unemployment
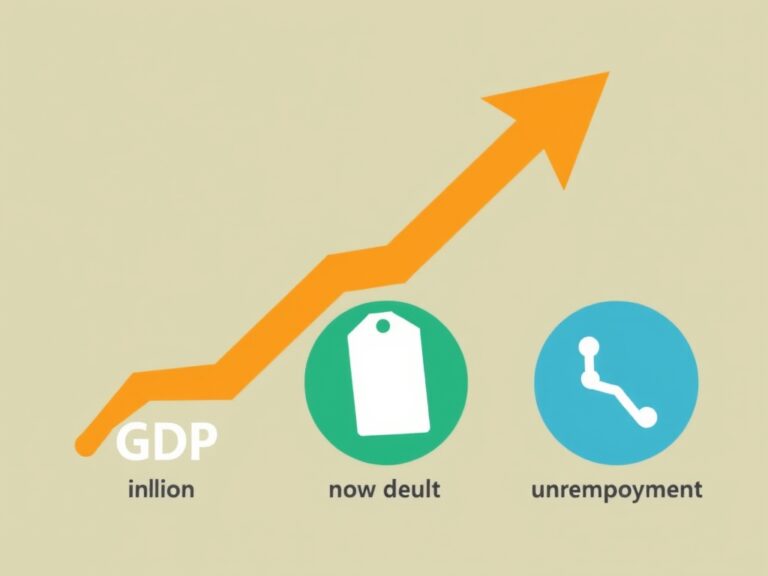
To really grasp how the market moves, you need to be familiar with the Big Three economic indicators that capture the headlines. First, we have GDP (Gross Domestic Product), which is essentially the total value of all goods and services produced in a country; think of it as the economy’s report card. Next is Inflation, which measures how much your money’s purchasing power is changing over time—a critical factor for your household budget. Finally, we have the Unemployment Rate, which tracks how many people are looking for work versus those currently employed. These three work together to form a clear picture of economic health:
- GDP signals growth or contraction.
- Inflation warns of rising costs of living.
- Unemployment highlights labor market stability.
When these numbers move, central banks and investors pay close attention, often adjusting their strategies accordingly. For example, if inflation rises too fast, banks might hike interest rates, which directly impacts your mortgage and credit card bills. It is a domino effect that starts with these high-level statistics and ripples down to your daily financial decisions. Staying updated on these three will give you a major advantage in personal finance.
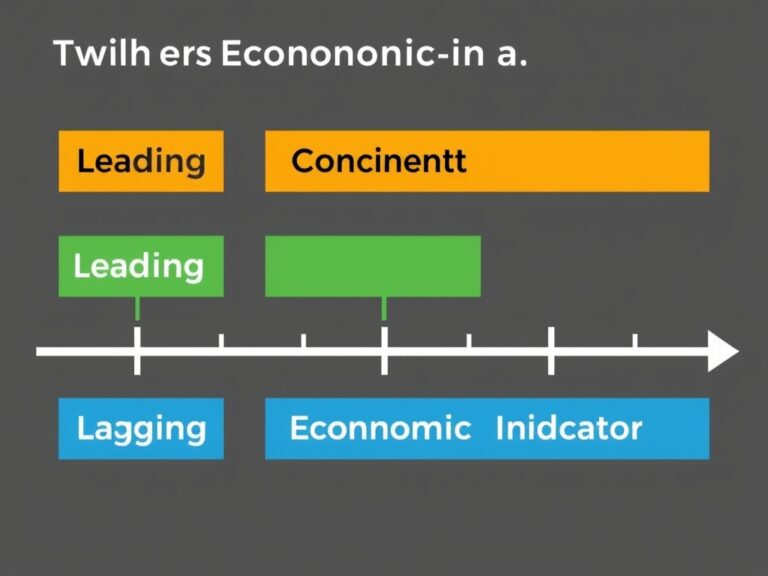
Leading, Lagging, and Coincident Indicators
Not all economic data points are created equal, and knowing their timing is key to mastering market trends. Experts categorize these indicators into three main buckets: leading, lagging, and coincident. Leading indicators are the crystal ball; they change before the economy actually shifts, such as stock market performance or new building permits. Lagging indicators happen after the fact, confirming a trend that has already begun, like the unemployment rate itself. Coincident indicators change at the same time as the economy, giving us a snapshot of the current situation. Why does this matter?
- Leading indicators help you prepare for the future.
- Coincident indicators help you assess your current reality.
- Lagging indicators help you validate past economic strategies.
By identifying which category a piece of news falls into, you can stop guessing and start analyzing with precision. Instead of reacting to every headline, you can learn to filter out the noise and focus on what truly indicates a long-term shift. This approach is what separates the savvy financial observer from the average reader who gets lost in the volatility.
Navigating the Market: How to Apply These Insights
So, you have the data—now how do you put it to work for your own financial planning? It all comes down to your personal strategy and risk tolerance, especially during times of economic uncertainty. If inflation is high, you might consider shifting your savings into assets that hedge against rising prices, such as commodities or real estate. If the GDP is slowing down, it might be the right time to review your debt and focus on building an emergency fund. Remember, the goal of understanding these trends is not to predict the exact top or bottom of a cycle, but to be prepared for whatever comes next. Practical steps to take:
- Set up alerts for major economic releases from government agencies.
- Diversify your investments to cushion against sector-specific downturns.
- Focus on long-term trends rather than daily market jitters.
Your financial journey is personal, and these indicators are just tools to help you make more informed choices every single day. Stay curious, keep learning, and don’t let market jargon scare you away from your goals. Knowledge is power, and now you have the tools to interpret the world of finance like a pro!