Market Trends Explained: A Plain-English Guide to Economic Indicators
Understanding the Pulse of the Global Economy
Have you ever wondered why the news keeps talking about market trends and confusing economic indicators? It might feel like you need a Ph.D. in finance to understand how the world moves, but I am here to break it down into plain English for you. Think of economic indicators as the health vitals of a country; just like your blood pressure or heart rate tells a doctor how you are doing, these metrics tell investors how the economy is performing. Whether it is inflation, GDP, or unemployment rates, these numbers are essentially the heartbeat of global markets. 📈 By learning to read these signs, you can make smarter decisions about your own money and investments. We are going to strip away the jargon and look at what actually matters for your daily life. Let’s dive into the core concepts that define our financial landscape and see how they connect to the prices you see at the grocery store. It is not just about Wall Street; it is about your street, too. Getting a grasp on these basics is the first step toward financial literacy in a complex world. Ready to decode the language of money? Let’s get started on this journey together as we demystify the numbers that move the world.

The Big Three: GDP, Inflation, and Unemployment
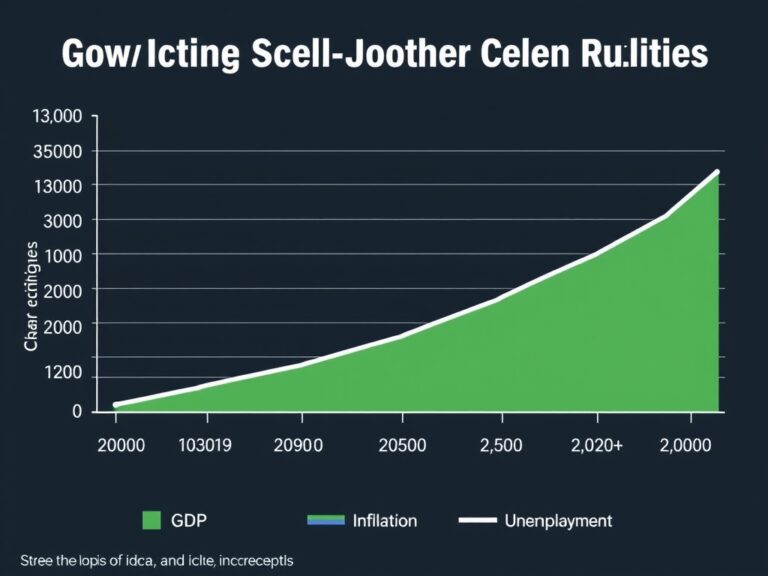
When you hear analysts talking about the economy, they are usually referencing three primary indicators that act as the pillars of financial health. First, GDP (Gross Domestic Product) is essentially the scorecard for a nation’s total economic production, measuring the value of all goods and services created.
- GDP Growth: A sign of expansion and opportunity.
- Inflation (CPI): The silent thief that changes your purchasing power.
- Unemployment Rate: A direct look at how many people are active in the workforce.
When GDP is rising, businesses usually expand and hire, which keeps the cycle moving forward in a positive direction. However, if inflation rises too fast, your dollar simply doesn’t stretch as far as it used to, which can be tricky for families. The unemployment rate is just as critical; it tells us how accessible jobs are for the average worker. When these three numbers are balanced, the economy feels stable and predictable for everyone involved. Keeping an eye on these data points helps you anticipate whether the future will bring more opportunities or tighten your budget significantly. It is all about balance, and as you learn these, you will start noticing how they fluctuate throughout the year. Don’t worry if it sounds like a lot; we will simplify how each piece interacts with your wallet next.
Leading, Lagging, and Coincident Indicators
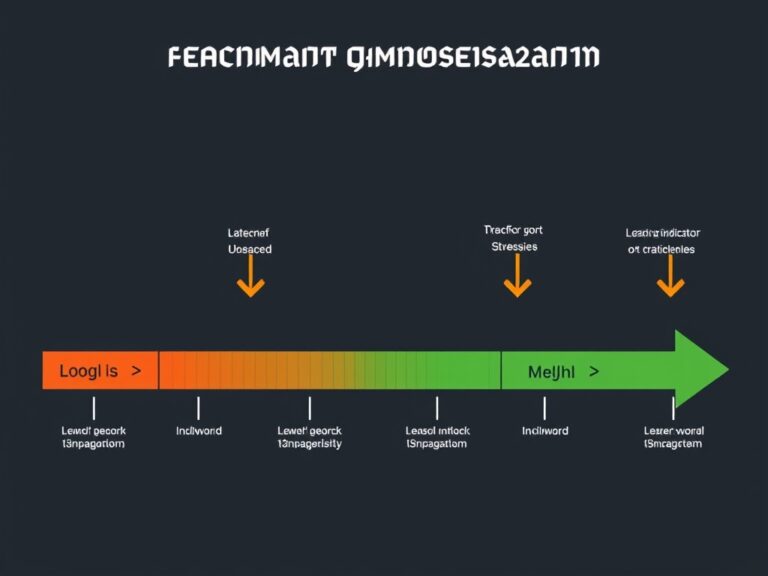
To really master market trends, you should know that not all data is created equal; economists categorize them into leading, lagging, and coincident indicators. Leading indicators are the crystal ball of the financial world because they predict where the economy is headed before it actually happens. For instance, the stock market or consumer confidence surveys are classic leading indicators that signal change is on the horizon. Lagging indicators, like the unemployment rate, actually confirm historical trends after they have already taken place in the real world. Coincident indicators move in tandem with the economy, giving us a real-time snapshot of the current situation. 💡 Understanding this distinction helps you avoid falling for ‘noise’ and allows you to focus on the signals that actually matter. If you only look at lagging indicators, you might be making decisions based on ‘yesterday’s news’ rather than preparing for tomorrow’s reality. By blending these perspectives, you become much more effective at gauging the true direction of the markets. It is about moving from being a passive observer to an informed participant in your financial future. This mental framework is what separates average investors from those who truly understand the underlying currents of the economy.
Turning Data Into Actionable Wisdom
Now that we have covered the basics, how can you actually use this information to improve your financial life? The goal is not to predict the market perfectly—because nobody can—but to understand the context of the environment you are living in. When you see news reports about rising interest rates, you can now intuitively understand that this is the central bank’s way of cooling down inflation. Empowerment comes from recognizing these patterns and adjusting your personal budget or investment strategy accordingly. Perhaps it means holding more cash when indicators point toward uncertainty or being more aggressive when growth metrics are soaring. Always remember that your long-term goals should dictate your strategy, not the daily fluctuations of a single indicator. Use these insights to filter out the panic and focus on the trends that have real staying power over years or decades. You are now equipped to look at financial news with a more critical and informed eye than ever before. Keep learning, stay curious, and continue observing how these indicators shift and evolve over time. You have the tools; now it is time to apply them with confidence in your personal financial journey. Your future self will certainly thank you for taking the time to master these essential economic concepts today.