
Decoding the Markets: A Plain-English Guide to Economic Indicators and Trends
Understanding the Pulse of the Global Economy
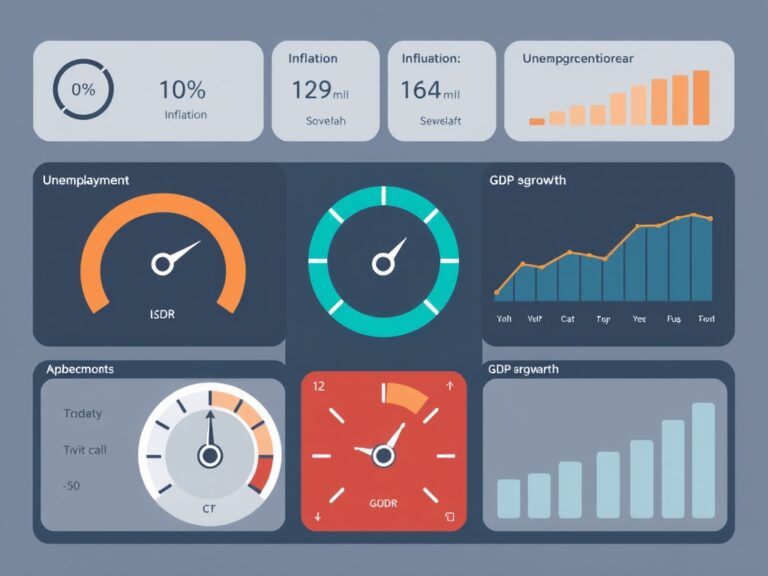
Have you ever wondered why the stock market zig-zags despite positive news, or why your grocery bill seems to climb even when inflation headlines cool down? Economic indicators are the vital signs of our financial world, acting as a compass for investors and everyday citizens alike. By learning to decode these metrics, you shift from being a passive observer to an informed participant in your own financial future. Whether it is the Gross Domestic Product (GDP) or the monthly Jobs Report, these data points tell a story about how businesses are spending, hiring, and growing. Think of these indicators as a complex dashboard in a cockpit; if you know how to read the gauges, you can anticipate turbulence before it hits. It is not just about numbers on a screen, but about understanding the macroeconomic trends that influence interest rates, housing prices, and your long-term savings. Let’s break down this complex web into manageable, plain-English concepts so you can navigate the markets with confidence and clarity. In this guide, we will explore the core pillars of economic analysis, ensuring you grasp exactly how these trends impact your wallet.
The Big Three: GDP, Inflation, and Employment
When you start digging into economic health, you must focus on the ‘Big Three’ indicators that move the needle:
- GDP (Gross Domestic Product): The total monetary value of all goods and services produced within a country.
- CPI (Consumer Price Index): The standard measure for inflation, tracking the price changes of a basket of consumer goods.
- Unemployment Rate: The percentage of the labor force actively seeking work but unable to find it.
These metrics act as the foundation for almost every central bank policy decision made today. When GDP is rising, it typically signals a healthy, expanding economy, but when it stalls, it could indicate an approaching recession. Meanwhile, inflation acts as the ‘hidden tax’ on your purchasing power; keeping it in check is the primary mission of institutions like the Federal Reserve. A tight labor market, where unemployment is low, often forces companies to raise wages, which can lead to higher consumer spending. However, it can also lead to wage-push inflation if not balanced correctly. Understanding the dance between these three elements is the secret to deciphering the economic landscape. By tracking these monthly releases, you gain an expert-level perspective on why the markets react the way they do during trading hours.
Leading vs. Lagging Indicators
To truly stay ahead of the curve, you need to distinguish between leading indicators, which forecast future activity, and lagging indicators, which confirm what has already happened. Leading indicators are the ‘crystal ball’ of the economy, including metrics like Stock Market Performance, Building Permits, and Manufacturing Orders. These data points shift before the overall economy changes direction, giving savvy investors a glimpse of the potential horizon. On the flip side, lagging indicators—such as the unemployment rate or corporate profits—reflect the results of past decisions and actions. Relying solely on lagging indicators is like driving a car while only looking in the rearview mirror; it confirms where you have been, but it won’t help you avoid the upcoming crash. Savvy market watchers utilize a blend of both, using leading indicators to build a thesis and lagging indicators to validate their broader outlook. This dual-layered approach is essential for anyone wanting to mitigate risk in volatile markets. By paying attention to these signals, you can adjust your portfolio or personal spending habits before the mainstream media catches on. It is a proactive strategy that separates the successful long-term investor from the panicked short-term speculator.

Putting It All Together: Your Actionable Strategy
Now that you know what these indicators represent, how do you actually apply this knowledge to your life? First, do not get overwhelmed by the daily noise; focus on the long-term trends rather than reactionary news cycles that disappear by tomorrow. Second, diversify your information sources, looking at reputable government data portals like the Bureau of Labor Statistics alongside high-quality financial analysis. Third, keep a simple journal of how your personal finances, like your mortgage rate or utility costs, correlate with the broader economic trends we’ve discussed. Remember that the market is inherently unpredictable, and even the most seasoned experts get it wrong sometimes. The goal isn’t to predict the future with 100% accuracy, but to manage your expectations and make informed decisions that align with your financial goals. By consistently observing these patterns, you will naturally develop a ‘gut feeling’ for when the economy is overheating or cooling down. Take a step back, look at the bigger picture, and trust the data over the hype. As you master these concepts, you’ll find yourself decoding the markets with the grace and insight of a seasoned economist, regardless of your background. Your financial journey is a marathon, not a sprint, and knowledge is your best training partner.