

Decoding the Economy: A Plain-English Guide to Market Movements and Indicators
Have you ever felt completely overwhelmed by the financial news, wondering how complex-sounding jargon like “quantitative easing” or “yield curve inversion” actually affects your daily life? You are definitely not alone, as the world of macroeconomics often feels like an exclusive club designed to keep everyday folks on the outside looking in. But here is a secret: decoding the economy doesn’t require a PhD in finance or a lifetime spent on a Wall Street trading floor. Stripped down to its core, the economy is simply a massive, interconnected network of human decisions, representing how we make, spend, save, and invest our hard-earned money. When we talk about market movements, we are really just talking about the collective emotional state and actions of millions of people responding to changing conditions. Understanding these patterns is incredibly empowering because it helps you make smarter decisions with your savings, career, and investments. Over the course of this guide, we will break down the complex indicators that guide the global markets into plain, simple English. We will look at how high-level data points trickle down to affect the price of your groceries, the interest rate on your mortgage, and the value of your retirement portfolio. Think of this as your personal roadmap to financial literacy, designed to turn confusing headlines into actionable insights. By learning to read the signposts of economic health, you can move from a state of financial anxiety to one of strategic confidence. So, let’s demystify the noise, peel back the layers of financial jargon, and discover how the economic engine really runs. Get ready to master the essential indicators that shape our financial world and dictate the future of global markets.
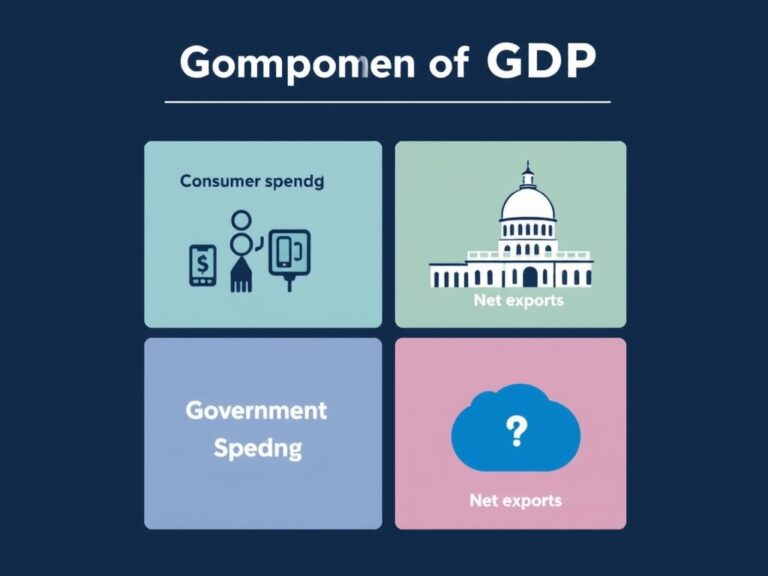
To truly understand where the economy is heading, we must first look at its ultimate scorecard: Gross Domestic Product (GDP). In simple terms, GDP represents the total monetary value of all goods and services produced within a country’s borders over a specific period, usually a year or a quarter. It acts like a giant thermometer, measuring whether the economic engine is running too hot, too cold, or just right. When GDP is growing steadily, it means businesses are selling more products, hiring more workers, and fueling prosperity. Conversely, if GDP shrinks for two consecutive quarters, the economy enters what economists officially call a recession. To make this easier to visualize, we can break down the primary components that make up GDP:
- Consumer Spending: This is the absolute powerhouse of the economy, representing everything from your weekly grocery haul to your latest vacation.
- Business Investment: This includes spending by companies on new equipment, factories, software, and research to grow their operations.
- Government Spending: This covers public investments in infrastructure, defense, healthcare, and education.
- Net Exports: The total value of a nation’s exports minus its imports, reflecting global demand for domestic products.
As an investor, tracking these components helps you understand which sectors are driving growth and which ones are dragging the market down. For instance, strong consumer spending numbers are usually a green light for retail and consumer discretionary stocks. On the flip side, a sudden drop in business investment might signal that corporations are bracing for tougher times ahead. By paying attention to these shifts, you can position your financial portfolio to ride the waves of growth rather than being caught off guard. Ultimately, GDP is not just a dry statistic; it is a vivid reflection of our collective productivity and economic vitality.
Now that we have covered the scorecard of the economy, let’s talk about the two most influential forces shaping your daily purchasing power: inflation and interest rates. You can think of inflation as the silent thief that slowly erodes the purchasing power of your money over time, making goods and services more expensive. While a little bit of inflation—usually around 2% per year—is considered a sign of a healthy, growing economy, rapid inflation can quickly turn into a financial headache. To combat this rising heat, central banks like the Federal Reserve use their most powerful tool: manipulating interest rates. When the central bank raises interest rates, it deliberately makes borrowing money more expensive for both consumers and businesses. This cooling mechanism affects several key areas of your personal finance:
- Mortgages and Loans: Higher rates mean you will pay more over time to finance a home, a car, or to carry credit card debt.
- Savings Accounts: On the bright side, banks will offer higher yields on your savings, rewarding you for keeping your cash secure.
- Business Expansion: Companies become more hesitant to take out loans for new projects, which slows down overall economic growth.
It is a delicate balancing act; if the Fed raises rates too aggressively, they risk triggering a recession, but if they leave them too low, inflation can spiral out of control. When interest rates rise, the stock market often experiences volatility because future corporate profits are discounted at a higher rate, making stocks less attractive. Conversely, when interest rates are low, money flows freely, credit is cheap, and stock prices often soar as investors seek better returns. Understanding this constant tug-of-war is crucial for anyone looking to navigate market cycles successfully. By keeping a close eye on central bank announcements, you can anticipate shifts in the market and adjust your investment strategy accordingly. Ultimately, masterfully managing these macroeconomic levers is what keeps the global financial system from veering off course.
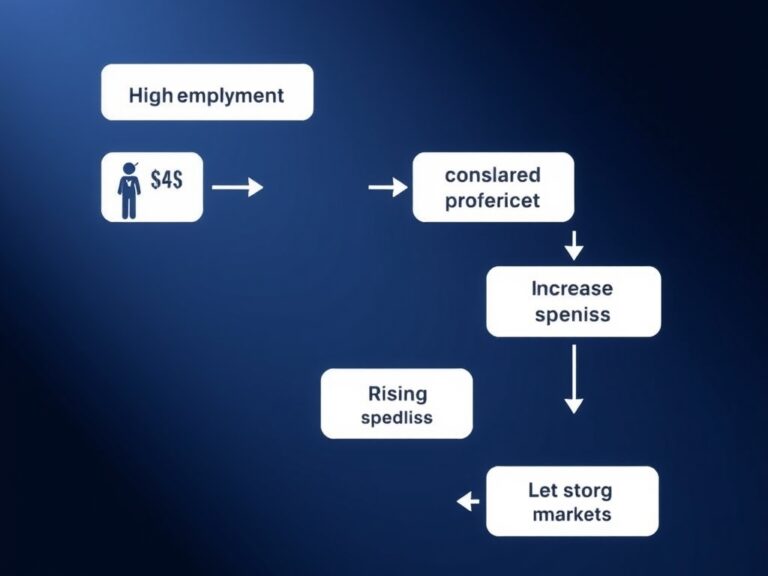
Beyond the abstract numbers of GDP and interest rates, the true heartbeat of the economy lies in the job market and consumer sentiment. The health of the job market is primarily measured through the monthly employment reports, which include key metrics like the unemployment rate and non-farm payrolls. When businesses are actively hiring and unemployment is low, people feel a sense of job security and financial stability. This security directly translates into higher consumer confidence, which is a psychological measure of how optimistic people feel about their financial future. Since consumer spending accounts for nearly 70% of all economic activity in the United States, confident consumers are the absolute engine of economic expansion. Let’s look at how this positive cycle plays out in real life:
- Job Security: A stable job gives you the confidence to make major life purchases, like buying a new home or upgrading your vehicle.
- Discretionary Spending: When people have extra cash, they spend it on dining out, traveling, and entertainment, boosting corporate revenues.
- Corporate Earnings: As businesses see their sales rise, their stock prices climb, creating a wealth effect that benefits investors.
However, if the job market starts to weaken and companies begin announcing mass layoffs, consumer confidence quickly plummets. People instinctively tighten their belts, cut back on non-essential spending, and start saving every penny they can. This drop in spending can quickly lead to lower corporate profits, a declining stock market, and eventually, an economic slowdown. Therefore, keeping tabs on employment figures and consumer sentiment indexes gives you an incredibly accurate preview of future retail sales and market performance. It is the ultimate leading indicator of human behavior, showing us whether people are ready to spend or preparing to hunker down. By monitoring these trends, you can gain a deeper understanding of the underlying strength of the economy before it shows up in official GDP reports.
Armed with this knowledge, how do you pull all these pieces together to navigate the financial markets like a seasoned pro? The key lies in understanding the difference between leading indicators, which look ahead, and lagging indicators, which look backward. For example, the stock market itself is actually a leading indicator because it represents the collective expectations of investors for future corporate earnings. This is why the stock market can sometimes rally even when the current economic news seems gloomy, as investors are already looking ahead to better times. To keep your bearings during these confusing periods, it is helpful to monitor key market benchmarks and indicators:
- The S&P 500 Index: A broad measure of the 500 largest publicly traded companies in the US, acting as a reliable barometer of overall market health.
- The Yield Curve: A graph that plots interest rates of bonds with different maturities, often watched for signs of upcoming recessions.
- Leading Economic Index (LEI): A composite index designed to signal peaks and troughs in the business cycle before they happen.
By tracking these metrics, you can separate short-term market noise from long-term economic trends. Remember, successful investing is not about trying to time the market perfectly or panic-selling every time there is a correction. Instead, it is about understanding where we are in the broader business cycle and aligning your investment portfolio with those realities. When the economy is expanding, cyclical stocks like technology and industrials often outperform. Conversely, during economic downturns, defensive sectors like utilities and consumer staples tend to hold their value much better. With a solid grasp of these indicators, you can make calm, rational financial decisions instead of emotional ones. Ultimately, decoding the economy is not about predicting the future with absolute certainty; it is about managing risk and seizing opportunities with confidence.