
Market Movements and Economic Indicators Explained in Plain English
Understanding Market Movements: Why Does the Stock Market Actually Move?
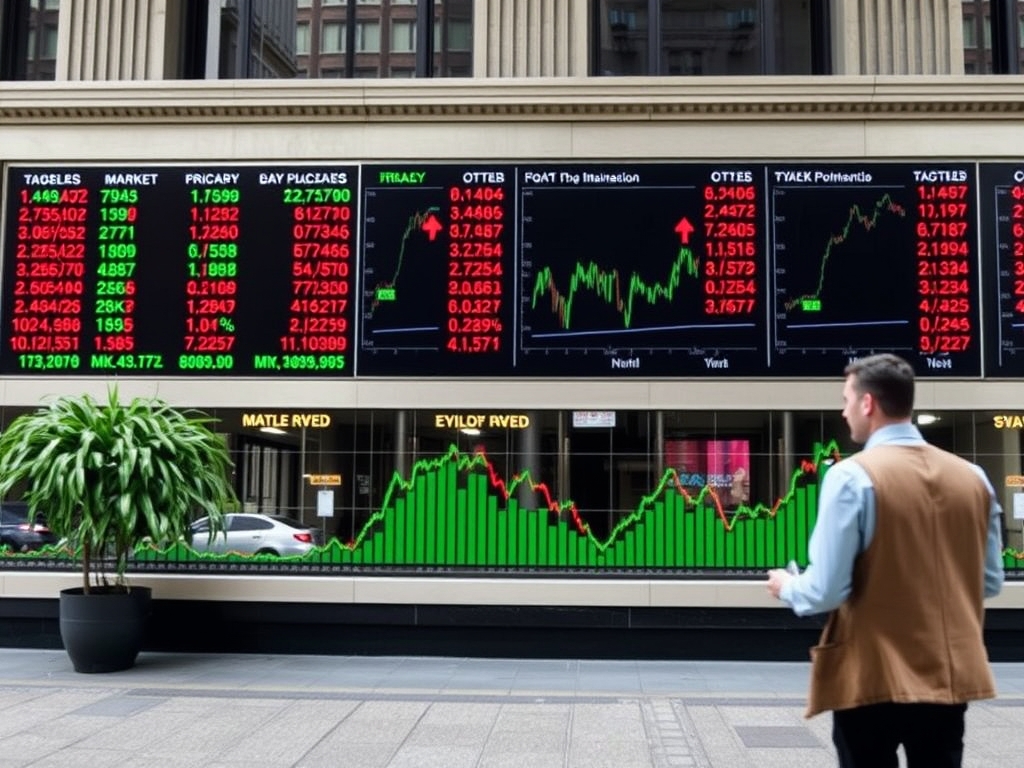
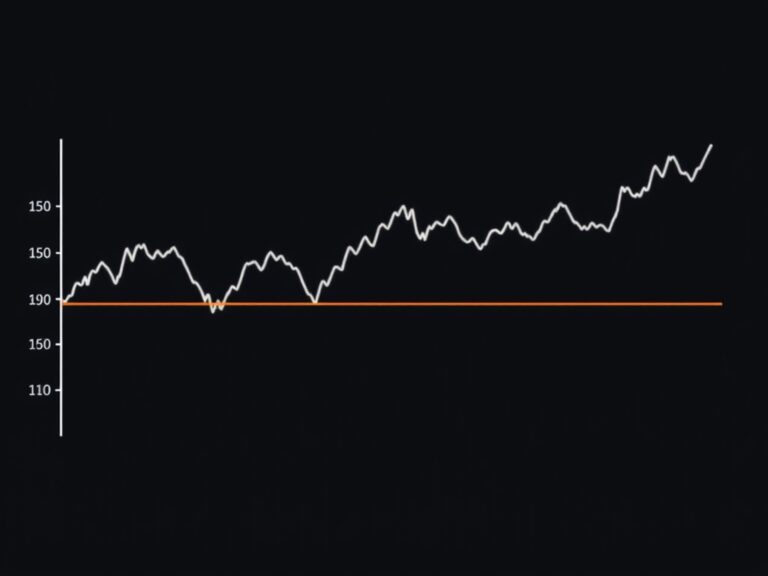
Have you ever looked at the stock market charts and wondered why prices seem to dance up and down like a rollercoaster? 📈 Market movements aren’t just random chaos; they are essentially the collective heartbeat of global sentiment and economic data reacting in real-time. When we talk about these fluctuations, we are really looking at how investors weigh future expectations against current realities. It’s a bit like a giant game of musical chairs where the music is played by economic reports, corporate earnings, and global news. Key takeaway: markets are forward-looking engines that try to predict what happens next, not just what is happening right now. By understanding that prices reflect future hopes and fears, you can stop panicking over daily dips. Keep in mind that a single day’s movement rarely tells the whole story of an asset’s health. Staying informed is your best defense against emotional trading decisions that often lead to unnecessary losses. Remember, even the most stable companies experience volatility during periods of uncertainty. It is all part of the natural rhythm of a healthy, functioning financial system that we call the market.
The Essential Economic Indicators You Need to Watch
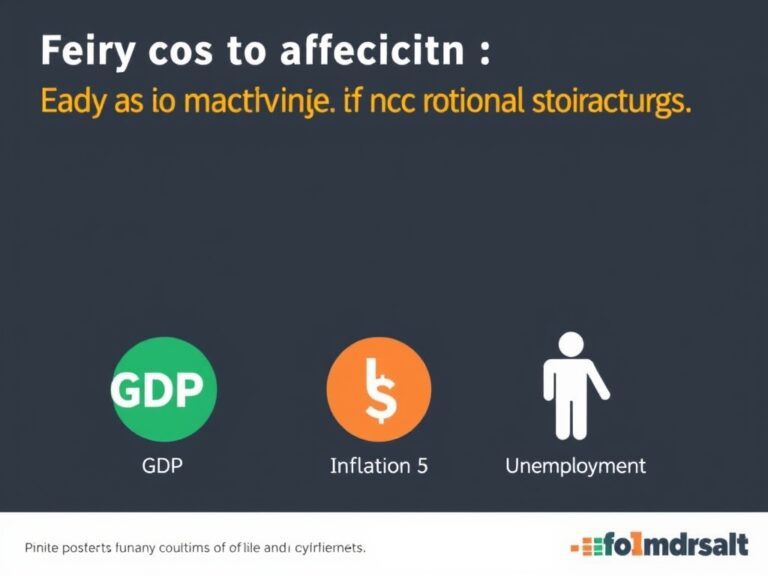
To really get a handle on where the economy is headed, you have to keep an eye on a few critical metrics, often referred to as economic indicators. Think of these as the dashboard lights in your car; they tell you if the engine is running smoothly or if you’re heading for a breakdown.
- GDP (Gross Domestic Product): The total value of goods and services produced in a country.
- Inflation (CPI): How fast the cost of living is rising.
- Unemployment Rate: The percentage of the workforce currently without a job.
When GDP is growing, it usually means businesses are thriving and consumer spending is up, which is great for stocks. Conversely, if inflation spikes, it can eat away at your purchasing power and force central banks to raise interest rates. These indicators don’t just affect Wall Street; they dictate the price of your groceries, your mortgage rates, and even your job security. Expert Tip: Always watch the ‘real’ numbers rather than just the headlines to avoid falling for sensationalist financial news. Understanding these markers helps you piece together the puzzle of the broader economic environment. It’s like having a map while everyone else is wandering through the fog without a guide.
How Interest Rates and Central Banks Influence Your Wallet
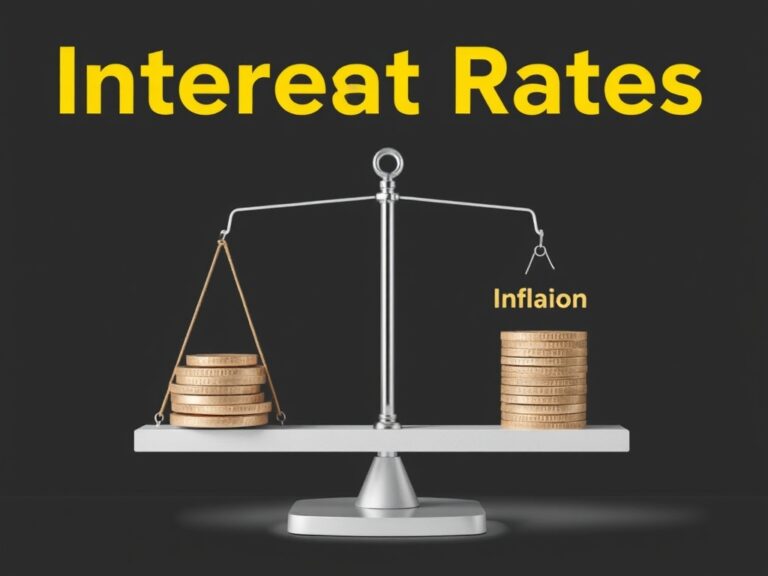
Perhaps no force is as powerful in the financial world as the central bank’s decision on interest rates. When the Federal Reserve—or any central bank—adjusts these rates, it creates a ripple effect that touches literally every corner of the economy. 💡 Low interest rates act like a shot of adrenaline, making it cheap for businesses to borrow money and expand operations. This usually leads to more hiring, higher consumer confidence, and a general surge in the stock market. However, when rates are high, borrowing becomes expensive, which cools down the economy and can slow the pace of market growth. Why does this matter to you? Because your savings account interest, credit card APR, and home loan rates are all tied to these policy shifts. By keeping an eye on central bank meeting minutes, you can get a head start on understanding future market trends before they hit the evening news. Don’t let these complex terms intimidate you; just think of interest rates as the ‘price of money.’ When money is expensive, growth slows down, and when money is cheap, the economy usually accelerates. It is the fundamental lever that keeps the entire financial system in balance.
Putting It All Together: A Simple Strategy for Success
Now that you know what drives the market, how do you actually use this information without getting overwhelmed? The best approach is to build a diversified portfolio that can weather the storm regardless of what the latest indicators say. 🌟 Don’t try to time the market based on a single piece of news; instead, focus on your long-term goals and stay consistent with your investments.
- Keep an emergency fund in cash.
- Focus on high-quality assets.
- Avoid over-reacting to short-term volatility.
By maintaining a cool head, you stop being a spectator to market chaos and start becoming a strategic participant. Final thought: Education is the best hedge against risk, and the fact that you’re reading this puts you ahead of the average investor. Keep learning, keep analyzing, and remember that slow and steady growth often beats the get-rich-quick schemes. The market will always have its ups and downs, but with a solid foundation of knowledge, you’ll be ready for whatever comes next. Stick to your plan, trust the process, and watch your financial future grow over the coming years through discipline and smart, informed choices every single day.