

Decoding the Markets: A Plain-English Guide to Economic Indicators and Trends
Understanding the Economic Pulse: Why Indicators Matter
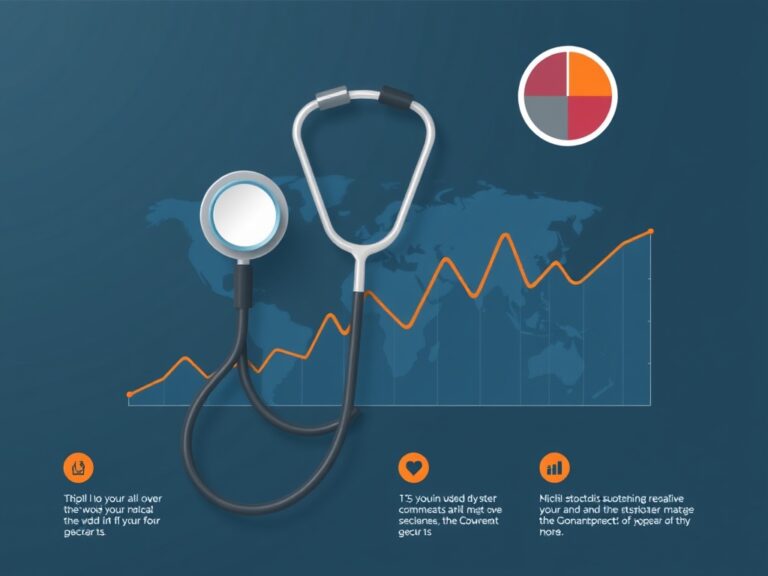
Have you ever wondered why the stock market jumps every time a new jobs report hits the wires? Decoding the markets might feel like trying to solve a cryptic puzzle, but it is actually much simpler than you think when you understand economic indicators. These data points act like a financial stethoscope, allowing investors to listen to the heartbeat of the global economy. By tracking these trends, you can transition from guessing to making informed, data-driven decisions about your personal portfolio. We are going to strip away the jargon and show you exactly what moves the needle in the financial world. Whether you are a beginner investor or someone looking to sharpen their analytical skills, this guide is your roadmap. It is not just about numbers; it is about telling the story of how businesses, governments, and consumers are behaving. Let us dive into the core metrics that every savvy market participant should monitor closely to stay ahead of the curve. Trust me, once you grasp these basics, reading the financial news will feel like a whole new experience.
The Big Three: GDP, Inflation, and Unemployment
At the center of any market analysis, you will find three primary indicators that shape investor sentiment:
- GDP (Gross Domestic Product): The total health of the economy’s output.
- Inflation (CPI/PPI): The silent thief that dictates purchasing power.
- Unemployment Rates: A proxy for consumer health and spending capacity.
Understanding how these interact is crucial for predicting market cycles. For instance, if GDP is growing while inflation remains stable, we are usually in a ‘Goldilocks’ environment, which is typically great for stocks. Conversely, high inflation often forces central banks to raise interest rates, which can cool down the market significantly. You should pay attention to the monthly releases of these figures because they trigger major volatility across asset classes. Investors often look for discrepancies between market expectations and the actual data released by agencies. Learning to interpret these reports allows you to anticipate potential policy shifts from institutions like the Federal Reserve. This is the cornerstone of macroeconomic trend analysis that separates the pros from the casual observers. Keeping an eye on these helps you manage risk during turbulent times effectively.

Leading vs. Lagging: Knowing When to Act
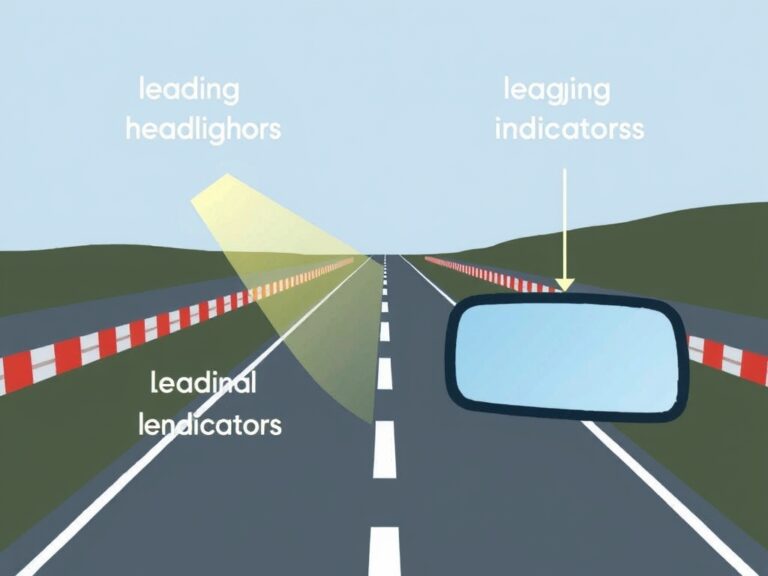
Not all data is created equal, and knowing the difference between leading and lagging indicators is your secret weapon. Leading indicators, like the Purchasing Managers’ Index (PMI) or building permits, provide a glimpse into the future by showing where the economy is headed before it actually gets there. Lagging indicators, such as corporate profits or the unemployment rate, confirm the trends that have already taken hold in the market. A successful strategy requires a balanced diet of both; relying on just one can lead to blind spots in your investment thesis.
- Use leading indicators to position your portfolio for upcoming changes.
- Use lagging indicators to validate your long-term economic outlook.
By ignoring one side of this equation, you might end up reacting to ‘old news’ while the market has already moved on to the next chapter. It is all about timing your moves based on the velocity of these economic signals. For example, if manufacturing output starts to slow, it is often a precursor to a wider economic cooldown. Master this distinction, and you will find yourself much less likely to be surprised by sudden market shifts. Remember, patience is key when these indicators conflict with each other.
The Human Element: Consumer Confidence and Sentiment
While spreadsheets are essential, do not forget that the economy is ultimately driven by human behavior. The Consumer Confidence Index acts as a window into how optimistic—or pessimistic—the average person feels about their financial future. When people feel secure, they spend more money, which fuels corporate growth and boosts stock prices. Conversely, if sentiment drops, businesses may pull back on hiring and investment, creating a self-fulfilling cycle of contraction. Psychology plays a massive role in how markets react to objective data. As an investor, you should watch for shifts in mood, as these often precede major changes in spending habits. It is fascinating to see how a simple survey can move markets, but that is the reality of our interconnected world. By blending hard data with market sentiment analysis, you gain a much more holistic view of the landscape. Keep your ears open for the general vibe in social and news media to gauge if greed or fear is currently driving the market. Stay disciplined, keep learning, and you will navigate the markets with confidence!