

Decoding the Markets: A Plain-English Guide to Economic Indicators and Trends
Understanding Economic Indicators: Your Compass in the Market
Have you ever glanced at a financial news headline and felt like it was written in a foreign language? You aren’t alone, as decoding the markets is often treated like a secret art, but it really boils down to reading the signals. Economic indicators are essentially the vital signs of our global economy, giving us a peek into whether things are heating up or cooling down. When we talk about these trends, we aren’t just looking at boring spreadsheets; we are looking at the story of how businesses, governments, and consumers interact every day. Think of your portfolio like a ship; economic indicators are the navigational tools that help you steer clear of choppy waters. Whether it is inflation rates, unemployment data, or retail sales, these metrics provide the ‘big picture’ context needed for sound decision-making. By learning to interpret these numbers, you transform from a passive observer into an informed participant. Let’s break down why paying attention to these shifts is the smartest move you can make for your financial future. It is not about predicting the future with a crystal ball, but rather understanding the current reality so you can act with confidence. Are you ready to start demystifying the jargon and taking control of your financial knowledge? Let’s dive into the core indicators that really move the needle for your investments.
The Big Three: GDP, Inflation, and Employment
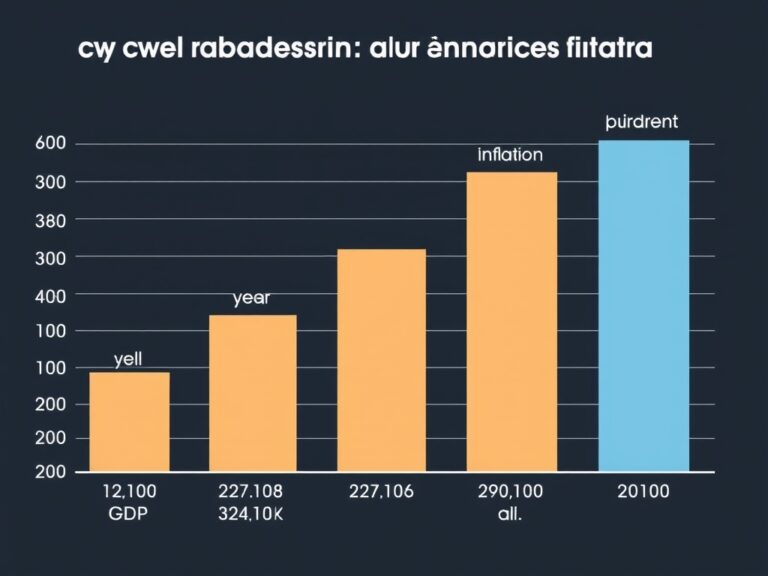
If you only watch three things, make them GDP (Gross Domestic Product), Inflation (CPI), and Unemployment Rates. These are the heavy hitters that central banks and investors monitor religiously to judge economic health.
- GDP measures the total value of goods and services; think of it as the scoreboard for national productivity.
- Inflation, measured by the Consumer Price Index, tracks the rising cost of your morning coffee and everything else, signaling purchasing power shifts.
- Employment data reveals how many people have steady paychecks, which directly drives consumer spending.
When GDP grows, it usually means businesses are thriving, which often leads to job creation. However, if inflation runs too high, the ‘cost of living’ crunch begins to eat away at those gains, forcing the Federal Reserve to consider interest rate hikes. It is a delicate balancing act that requires constant monitoring of the Phillips Curve relationship between job growth and inflation. Understanding these three pillars allows you to see the underlying pulse of the economy. By keeping these metrics in your toolkit, you can better anticipate how market cycles might affect your personal bottom line. They are the foundation upon which all other market trends are built, so don’t overlook them.
Consumer Sentiment: The Pulse of Market Confidence
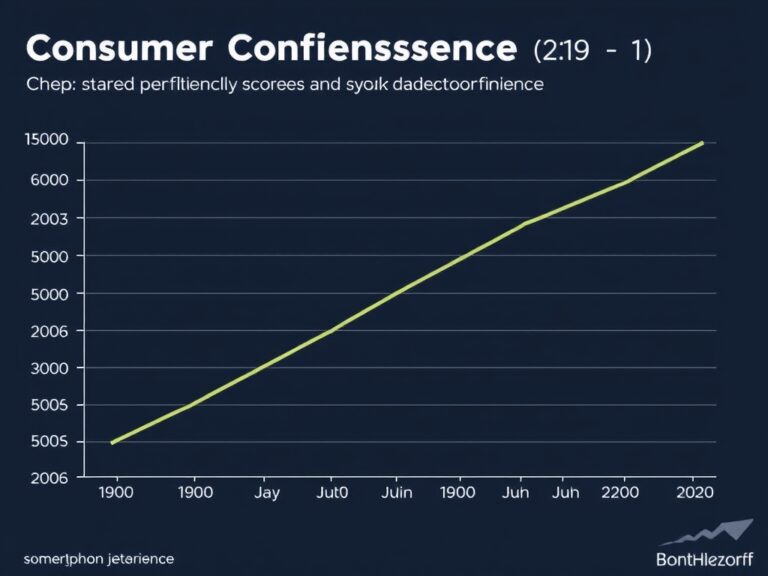
While hard numbers like GDP are essential, you cannot ignore the human element, which is why Consumer Sentiment is such a powerful leading indicator. If people feel wealthy and secure, they spend more money, which fuels corporate profits and economic expansion. Conversely, when fear or uncertainty sets in, consumer spending contracts, often acting as a precursor to a market downturn.
- Consumer confidence surveys ask real people about their job security and future spending plans.
- Retail sales data provides a hard look at where that sentiment is actually being turned into dollars.
- Household debt levels reveal how much ‘fuel’ consumers have left for future purchases.
You might be surprised how much simple perception impacts the complex machinery of global trade. When news outlets report on ‘market volatility,’ it is often reflecting this underlying swing in public confidence. By keeping an eye on these sentiment indicators, you can gain a sense of the mood before it fully translates into the prices of your stocks or bonds. It is the difference between reacting to a headline and anticipating a shift in market psychology. Remember, the market is ultimately driven by human decisions, and sentiment is the engine behind those choices. Stay observant, and you will start to spot the trends before they hit the mainstream media.
Putting It All Together: Your Actionable Strategy
Now that you have a grasp of the key players, how do you actually apply this to your daily life or investment strategy? The trick is to synthesize the data rather than obsessing over a single volatile day of trading. Start by setting up a simple tracking dashboard where you check the monthly release calendars for jobs reports and CPI data. Consistency is key, as trends rarely happen in a vacuum; they develop over weeks and months.
- Don’t panic over one bad report; look for a sustained trend over two or three quarters.
- Diversify your investments to buffer against the impact of unexpected economic ‘shocks.’
- Always keep an eye on how these indicators influence Interest Rates, as they affect everything from your mortgage to corporate loans.
By adopting this structured approach, you turn the noise of the market into actionable intelligence. You will find that you are less prone to emotional decision-making when you have the data to back up your moves. Remember, the goal of decoding the markets is to gain clarity, not to become overwhelmed by infinite data points. Stay curious, keep learning, and don’t be afraid to adjust your strategy as the economic landscape evolves. Your financial future is worth the extra effort it takes to stay informed and ahead of the curve. Keep watching the indicators, and keep growing your knowledge base every single day.