

Understanding Market Movements and Economic Indicators: A Plain-English Guide
Decoding the Pulse of the Global Market
Have you ever wondered why the stock market seems to dance to its own rhythm, sometimes soaring on good news and other times plummeting without warning? Understanding market movements can feel like trying to solve a complex puzzle, but it really boils down to how investors react to the world around them. At its core, the market acts as a giant barometer, constantly attempting to predict the future health of our economy. You don’t need a degree in finance to grasp these shifts; you just need to learn how to read the signals. Think of it as tuning into a radio station: there is a lot of static, but if you know which frequencies to listen for, you can hear the music clearly. In this guide, we will break down the essential components that drive these fluctuations. Whether you are a seasoned investor or just starting, knowing the basics is your first step toward financial literacy. Let’s peel back the layers and look at what truly moves the needle. By the end of this post, you’ll feel much more confident interpreting financial headlines. Knowledge is your greatest asset in the world of trading, so let’s get started.

The Big Three: Key Economic Indicators
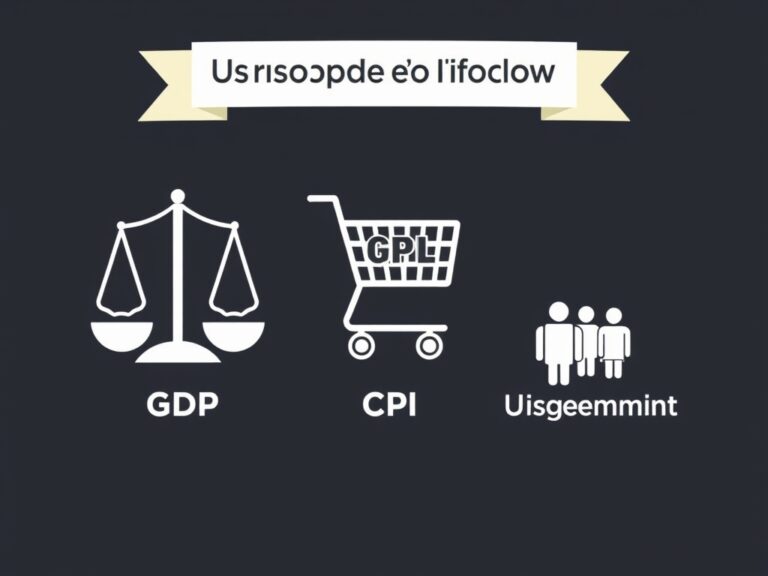
To really get a handle on market direction, you have to look at the primary economic indicators that central banks and institutions track religiously. First, we have Gross Domestic Product (GDP), which measures the total value of goods and services produced within a country; think of it as the scoreboard for economic health. Next, the Consumer Price Index (CPI) tracks inflation, showing us how the cost of living changes over time and impacting your personal purchasing power. Finally, the Unemployment Rate tells us how many people are looking for work, which is a major driver of consumer confidence. When these metrics move, they send shockwaves through the financial markets.
- GDP growth usually signals a bull market.
- High inflation often prompts interest rate hikes.
- Rising unemployment can lead to cautious spending and market dips.
These data points act as the foundation for almost every major investment decision made by professionals today. By paying attention to these reports, you can anticipate potential market shifts rather than just reacting to them. It is all about connecting the dots between raw data and real-world outcomes. Keeping an eye on these indicators is like checking the weather report before heading out for a long trip.
Interest Rates: The Engine of the Economy
If you want to know what drives the market more than anything else, keep your eyes fixed on interest rates set by central banks like the Federal Reserve. When rates are low, borrowing money is cheap, which encourages businesses to expand and consumers to spend, fueling economic growth and driving stock prices upward. Conversely, when the central bank decides to raise rates to fight inflation, it makes borrowing expensive, which often cools down the market and slows spending. This delicate balancing act is the primary lever that dictates the cost of capital for every company on the market. Understanding this relationship helps you see why the market might react strongly to even a slight rumor of a rate change. Investors are always trying to predict the next move by central bankers, often referred to as the ‘Fed watch.’ It is essentially a game of chicken between economic growth and inflation control. When you understand this dynamic, you can better position your portfolio to withstand or benefit from these shifts. Interest rates truly are the heartbeat of the modern financial system. Watching them is mandatory for anyone serious about managing their wealth effectively.
Putting It All Together: Your Strategy
Now that we have covered the basics, you might be asking how to use this market analysis in your daily life. The secret isn’t to chase every single headline or panic during a temporary dip; rather, it is to build a strategy that acknowledges these economic cycles. Long-term success comes from staying informed but remaining disciplined in the face of market volatility. Use these economic indicators as a compass, not as a crystal ball, because markets can be irrational in the short term. Always diversify your holdings so that you aren’t overly exposed to just one sector or asset class. Remember these key takeaways for your journey:
- Stay Patient: Markets take time to reflect economic realities.
- Keep Learning: The economic landscape is always evolving.
- Manage Risk: Never invest money that you might need for short-term expenses.
By keeping a level head and watching these indicators, you are already ahead of the average investor. The goal is to make smart, informed decisions that align with your personal goals. Take a deep breath, trust your research, and keep your long-term objectives in focus. Investing is a marathon, not a sprint, so pace yourself as you navigate the market’s ups and downs.