
Understanding Market Trends: A Plain-English Guide to Economic Indicators
Decoding the Pulse of the Economy
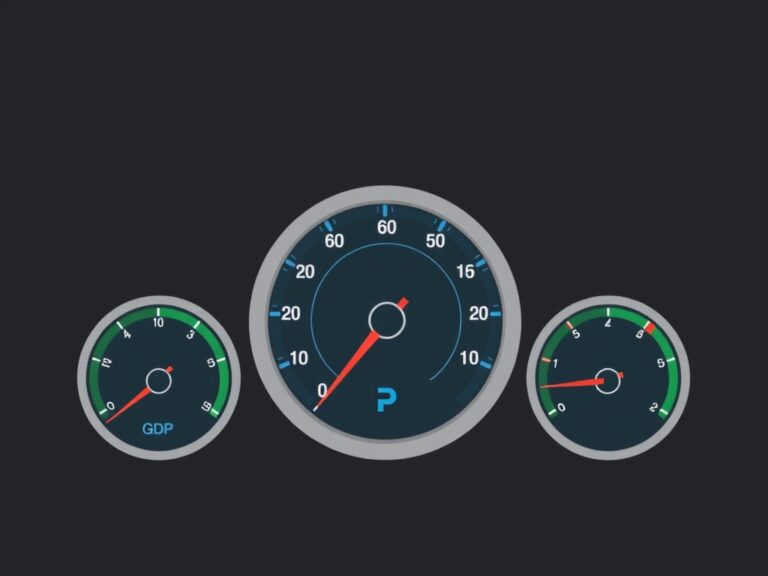
Have you ever wondered why the news gets so excited—or panicked—every time a new government report drops? You are likely hearing about economic indicators, which are essentially the ‘vital signs’ of the global financial body. Think of them as a dashboard for the economy; just as your car has gauges for speed and fuel, the market has data points like GDP and inflation to tell us how things are running. Understanding these trends isn’t just for Wall Street pros in expensive suits; it is a vital skill for anyone managing personal savings or running a business. When we talk about market trends, we are really just looking at the aggregate behavior of millions of people making choices every day. By learning to interpret these signals, you can anticipate shifts before they become mainstream headlines. This guide is designed to strip away the jargon and give you a clear roadmap for navigating the economic landscape. Let’s dive into what these numbers actually mean for your wallet. It might seem intimidating at first, but once you break it down, it is surprisingly logical. Ready to sharpen your financial intuition? Let’s get started on this journey together.
The Big Three: GDP, Inflation, and Unemployment
If you only watch three indicators, make sure these are the ones on your radar.
- GDP (Gross Domestic Product) measures the total value of all goods and services, essentially the economy’s ‘size.’
- Inflation (CPI) tracks how fast prices are rising, which tells us about your purchasing power.
- Unemployment Rates indicate how many people are looking for work, serving as a pulse check on consumer confidence.
When GDP is growing, businesses feel bold enough to expand, which usually drives down unemployment. Conversely, if inflation climbs too high, it acts like a hidden tax, eating away at your savings. You should think of these three as a delicate balancing act managed by central banks and government policy. For instance, if unemployment is too low, inflation might spike because workers have more leverage to demand higher wages, pushing up production costs. It is a constant game of tug-of-war between growth and stability. By monitoring these, you can gauge whether we are in a phase of expansion or a potential downturn. Keep an eye on the Bureau of Labor Statistics and government releases to stay informed. It is all about connecting these dots to form a bigger picture of where the market is heading next.
Leading vs. Lagging Indicators: Knowing the Timing
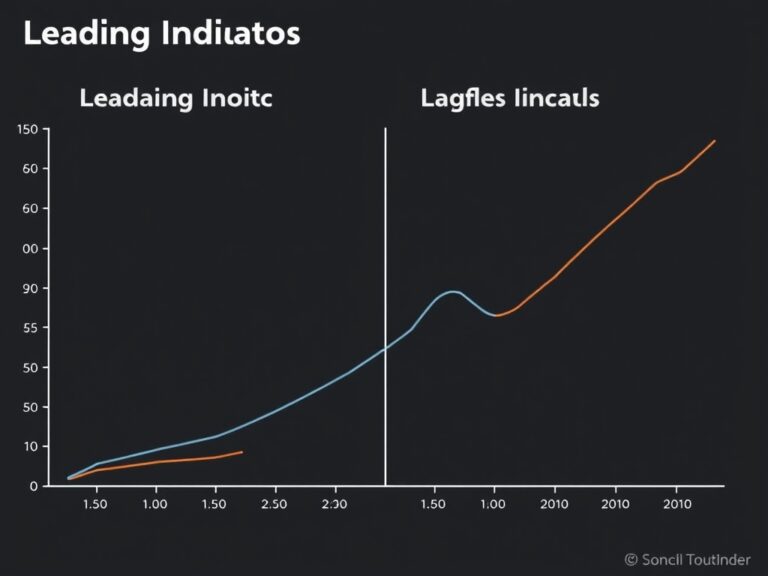
One of the biggest mistakes beginners make is reacting to lagging data as if it were a future prediction. Lagging indicators, like unemployment numbers, confirm trends that have already occurred, acting as a historical record of the market. On the flip side, leading indicators—like stock market performance, building permits, or consumer expectations—attempt to predict where the economy is going next. Imagine you are driving a car: looking at the speedometer is a lagging indicator of how fast you were going, but looking through the windshield is a leading indicator of the traffic ahead. To be a smart investor or business owner, you need to balance both types of data effectively. Relying solely on the past can leave you vulnerable to sudden shifts, while ignoring the past means you lack context for the present. Watch out for ‘false signals’ where one indicator might suggest a downturn while another implies growth; this is where critical thinking comes in. Always look for the consensus among multiple reports rather than betting on just one. By mastering this timing, you’ll stop feeling reactive and start feeling proactive about your financial decisions. It is the secret difference between just following the news and actually understanding it.
The Human Element: Consumer Confidence and Sentiment
Finally, we cannot ignore the psychological side of market trends, often measured by Consumer Confidence Surveys. Even if the ‘hard’ numbers like GDP look great, if people feel insecure about their jobs, they stop spending, which eventually causes the economy to stutter. Economics is, at its heart, a study of human behavior, and fear or optimism can become a self-fulfilling prophecy. When people feel optimistic, they invest, spend, and borrow, which fuels growth. If everyone is scared, they hunker down and save, which inadvertently slows down the engine of the economy. Pay attention to retail sales reports and consumer sentiment indices to get a sense of this ‘gut feeling’ that drives the market. You can often see these shifts in sentiment manifest in social media trends or local business activity long before they appear in official government reports. This is why paying attention to the people around you is just as important as reading spreadsheets. By blending quantitative data with qualitative sentiment, you build a much more robust understanding of market cycles. Remember, the market is composed of people just like you, all trying to navigate the same financial waters. Stay curious, stay informed, and always keep your long-term goals in sight amidst the short-term fluctuations.