
Understanding Market Trends: A Plain-English Guide to Economic Indicators
Decoding the Pulse of the Economy
Have you ever wondered why headlines scream about market shifts or why your grocery bill seems to change with the seasons? Understanding market trends isn’t just for Wall Street professionals; it is a vital skill for anyone looking to navigate their personal finances with confidence. At its core, an economic indicator is simply a piece of data that tells us how the economy is performing at a given time. Think of these indicators as the dashboard of a car, showing you the speed, fuel level, and temperature of the financial engine. Whether you are a business owner or a curious investor, knowing how to interpret these signals can help you make informed decisions. We will break down complex jargon into plain English so you can feel empowered by the numbers. By paying attention to these metrics, you can spot potential growth opportunities before they hit the mainstream media. It is about moving from guesswork to informed observation, which is the cornerstone of financial literacy. Let’s start this journey by simplifying the complex world of macroeconomics together. You might be surprised at how intuitive these concepts actually are once you strip away the technical fluff. Keep reading to transform the way you view the daily news cycle!

The Big Three: GDP, Inflation, and Employment
To grasp the broader economic landscape, you need to focus on three heavy hitters: GDP, Inflation, and the Unemployment Rate. These are the primary benchmarks used by economists to gauge the health of a nation.
- GDP (Gross Domestic Product): This measures the total value of goods and services produced within a country.
- Inflation: Simply put, it tracks the rate at which the cost of living increases over time.
- Employment Data: This tells us how many people are actively working and earning an income.
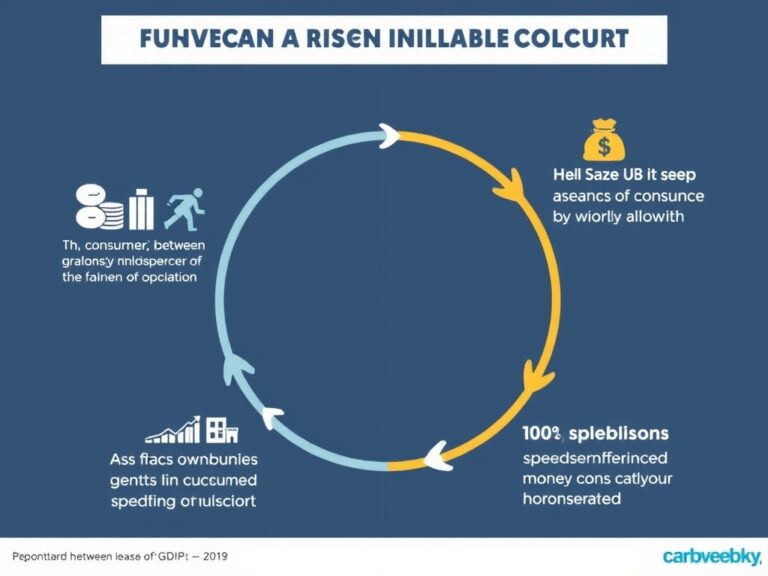
When GDP is rising, it often suggests a period of economic expansion, meaning businesses are thriving and innovation is high. Conversely, high inflation can erode your purchasing power, making that morning coffee feel a bit more expensive each month. The unemployment rate acts as a direct mirror to consumer confidence; when people have jobs, they spend more, which fuels the entire cycle. These indicators are reported regularly, often by government agencies, providing a snapshot of our collective financial reality. Understanding their relationship helps you see why central banks might raise or lower interest rates to stabilize the system. Learning to balance these three metrics will give you a solid foundation for analyzing any market trend you encounter. It is like having a secret decoder ring for the evening news!
Why Leading, Lagging, and Coincident Indicators Matter
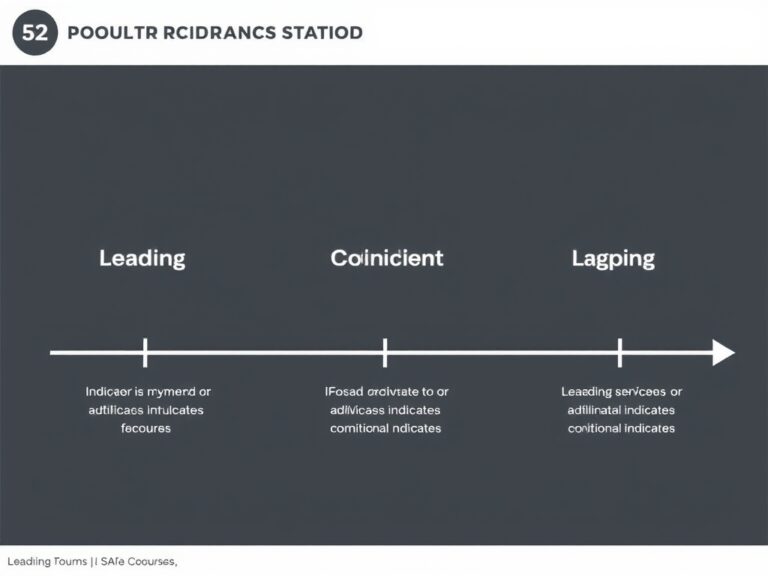
Not all economic data points function the same way, which is why classification is key to market trend analysis. Economists group these indicators into three specific categories: leading, lagging, and coincident. Leading indicators, like the stock market or building permits, are the crystal ball; they change before the economy as a whole shifts. They help investors anticipate future cycles, giving you a head start on preparing for a potential downturn or boom. Lagging indicators, such as the unemployment rate, confirm a trend that has already begun, providing retrospective validation. Coincident indicators, like manufacturing output, happen in real-time, giving you an accurate picture of where things stand right now. By blending these, you can create a 360-degree view of the economic environment without getting lost in the weeds. For instance, if leading indicators look gloomy but the coincident data remains strong, you can better manage your risk profile. Most people make the mistake of looking at just one number, which is like trying to navigate a ship using only one star. Instead, try to build a composite view that synthesizes all these different types of data. This approach reduces noise and focuses your attention on what truly moves the needle for your financial goals. It is the professional way to ensure you aren’t fooled by temporary market anomalies.
Putting It All Together: Your Actionable Strategy
Now that you have the vocabulary of an expert, how do you actually apply this to your daily life? Start by picking one or two reliable sources for economic news and stick with them to avoid information overload. Consistency is your greatest asset when tracking these trends over the long term. Remember, one outlier report does not make a market trend, so look for consistent patterns over several months rather than reacting to daily volatility. If you are planning a big purchase or an investment, check these indicators first to see if the timing aligns with the broader economic momentum. It is also helpful to observe how your own industry behaves in relation to these national metrics. Are you seeing an increase in hiring or a slowdown in supply chains? Sometimes, the most valuable insights come from observing the reality of your local economy. Keep an open mind, stay curious, and don’t be afraid to adjust your strategy as the data evolves. By maintaining this discerning perspective, you move from being a spectator to an active participant in your financial future. You have the tools to cut through the noise and focus on what matters most. Understanding market trends is a marathon, not a sprint, and you now have the map to guide you along the way. Go forth and analyze with confidence, knowing you have the insights needed to thrive in any market condition!