
Decoding the Markets: A Plain-English Guide to Economic Indicators and Trends
Decoding the Markets: Your Journey Starts Here
Have you ever watched the news and felt like market analysts are speaking a completely different language? You are certainly not alone, as the world of economic indicators can feel like a labyrinth of complex jargon and confusing charts. Think of the economy as a massive, living organism, and these indicators are simply the vital signs—like pulse, temperature, and blood pressure—that tell us how it is functioning. Understanding market trends doesn’t require a PhD in finance; it just takes a bit of curiosity and the right perspective to connect the dots. In this guide, we will break down the most impactful data points that move the needles on global exchanges. By the end of this post, you will be able to look at a headline about inflation or employment and immediately grasp its implications for your own portfolio. Let’s peel back the layers of these numbers and see what they really mean for your financial future. We’ll start by focusing on how these metrics influence everyday investment decisions. Grab a coffee, settle in, and let’s decode the financial world together in plain, simple English.
The Big Three: GDP, Inflation, and Employment
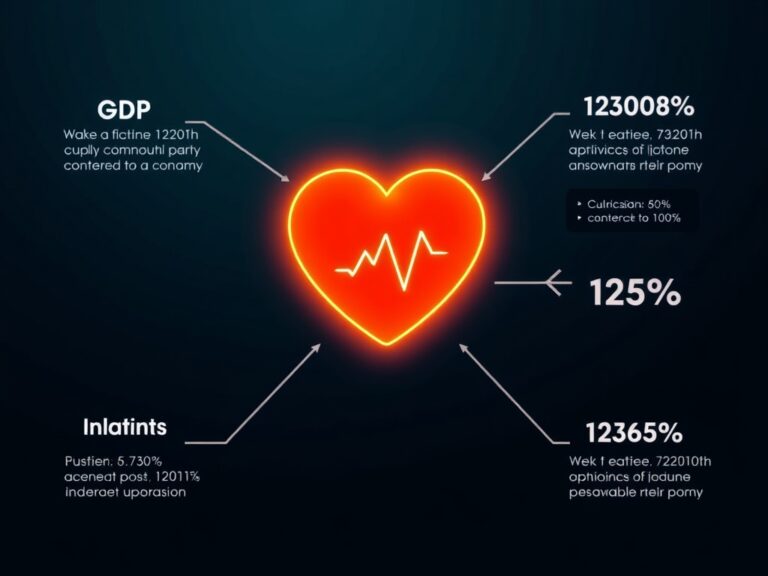
To truly get a handle on the markets, you need to understand the ‘Big Three’ indicators that act as the backbone of economic analysis. First, we have GDP (Gross Domestic Product), which is essentially the total value of all goods and services produced within a country; think of it as the ultimate scoreboard for economic health. Second, Inflation (often measured by the Consumer Price Index) tells us how much our purchasing power is shifting over time. When inflation rises, the cost of living climbs, which forces central banks to adjust their strategies. Third, the Employment Situation Report—specifically the non-farm payrolls—gives us a snapshot of how many people are working and earning, which drives consumer spending. When these three indicators perform well, the economy usually follows a path of steady growth. However, when they show unexpected volatility, investors often react with caution or rapid selling. Keep an eye on these three metrics, and you’ll already be ahead of the average news watcher. Here is a quick list of what to look for:
- GDP: Look for consistent, sustainable growth percentages.
- Inflation: Watch for a target rate usually around 2%.
- Jobs: Pay attention to wage growth trends rather than just raw hiring numbers.
Interest Rates: The Engine of Market Sentiment
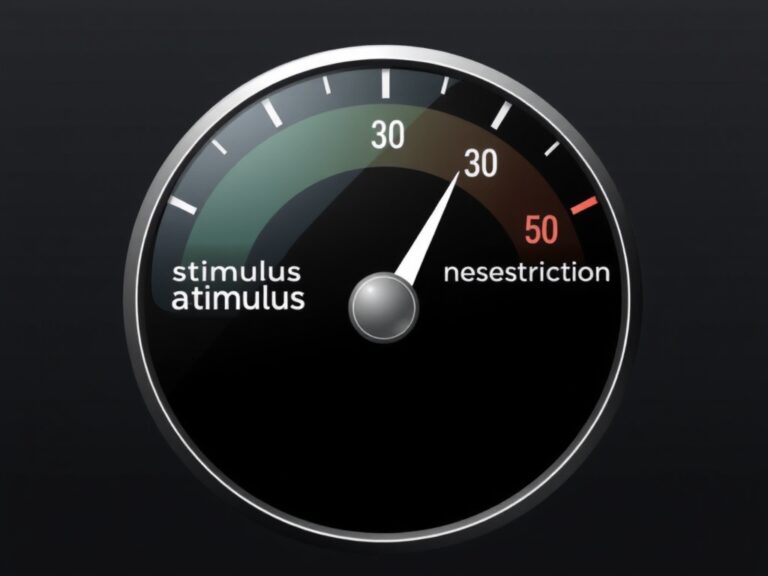
If GDP is the scoreboard, then interest rates are the engine that drives the entire market car forward or slams on the brakes. When central banks like the Federal Reserve decide to hike interest rates, borrowing becomes more expensive for businesses and consumers alike. This usually happens to cool down an overheating economy, but it can also dampen corporate investment and slow down stock market momentum. On the flip side, when rates are lowered, it acts like a stimulus shot, encouraging companies to expand and consumers to spend more freely. Understanding the relationship between these rates and market cycles is crucial for any investor looking to build a resilient strategy. Many people fear rate hikes, but they are simply a tool to manage the delicate balance between growth and stability. If you observe the Federal Reserve’s messaging, you can often anticipate potential market pivots before they actually hit the tickers. It is all about reading the tone of the central bank’s statements as much as the actual data they provide. Pro tip: Always watch the ‘dot plot’ forecasts for a glimpse into where the experts think rates are heading in the coming years.
Consumer Confidence and Sentiment
Finally, we cannot ignore the human element of the economy: Consumer Confidence. Even if the raw data looks stellar on paper, the market can stumble if the average person feels pessimistic about their personal future. This metric is usually derived from surveys that ask individuals about their job security, their current financial situation, and their outlook for the next six months. When consumer sentiment is high, people are more likely to buy big-ticket items like homes and cars, which powers the economy from the ground up. When sentiment drops, businesses often hit the pause button on expansion, leading to a potential market correction. It is a powerful psychological feedback loop that dictates how money flows into the stock market. You should view consumer sentiment as a leading indicator, providing a peek into where spending habits are headed before the actual sales numbers are released. Always ask yourself: ‘Am I feeling confident enough to spend right now?’ If the answer is no, it is likely that millions of others feel the same way. Keeping tabs on these feelings allows you to stay proactive rather than reactive in your financial planning journey.