
Making Sense of Markets: A Plain-English Guide to Economic Indicators and Trends
Understanding Economic Indicators: Your Personal Map to Market Trends
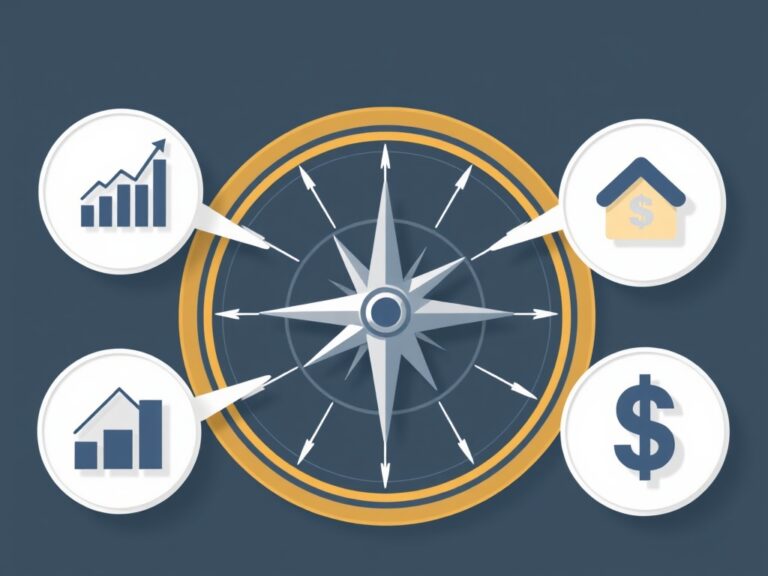
Have you ever felt like the world of finance is a puzzle where the pieces are constantly shifting? You’re not alone! Making sense of markets doesn’t require a PhD in economics; it just takes a bit of curiosity and the right guide. Think of economic indicators as the heartbeat of the global economy—they tell us whether things are healthy, heating up, or slowing down. When we talk about economic trends, we are simply looking at the direction in which these indicators are moving over time. By learning to read these signals, you can move from feeling overwhelmed to feeling empowered in your investment journey. Whether you are a beginner or looking to sharpen your skills, understanding these metrics is your first step toward financial literacy. Let’s break down the noise and focus on what truly matters for your wallet. It is all about connecting the dots between global events and your personal financial landscape. You don’t need a crystal ball when you have data on your side! Understanding these indicators is like having a reliable roadmap in a dense forest of information. Ready to decode the language of money? Let’s dive in together and make these concepts feel like common sense.
The Big Three: GDP, Inflation, and Employment
If you only watch three things, make them these pillars:
- GDP (Gross Domestic Product): The total value of goods and services produced.
- Inflation (CPI): The rate at which prices rise over time.
- Unemployment Rate: The percentage of the workforce currently without a job.
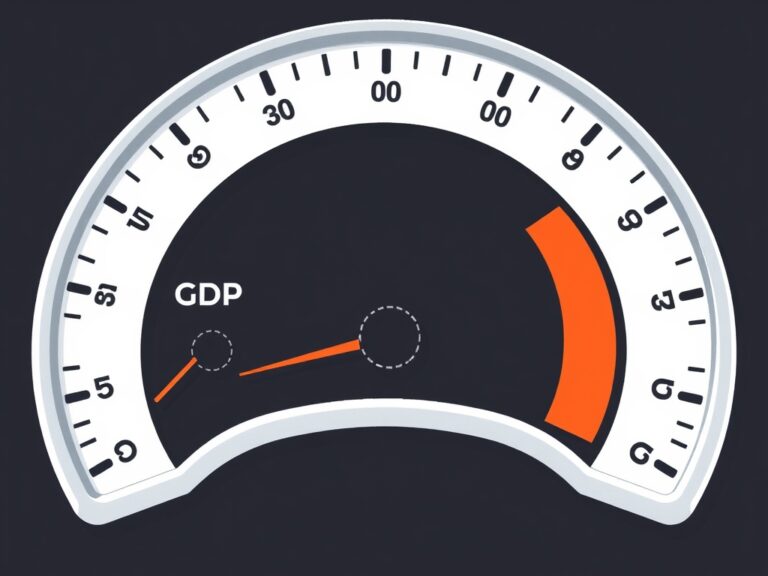
These indicators act as the primary health check for any economy. When GDP growth is positive, it usually signals a thriving business environment, which is generally good for investors. Conversely, high inflation can erode your purchasing power if your savings aren’t growing at a similar pace. The employment rate is equally vital because a strong job market means more consumer spending power, fueling further economic growth. Imagine the economy like a car engine; if the engine is running too hot, it needs cooling, and if it’s too sluggish, it needs a boost from central banks. Keeping an eye on these three metrics will give you 90% of the context you need to understand current market sentiment. They are the ‘big picture’ stats that influence everything from interest rates to the price of your daily latte. By mastering these, you’ll immediately see the news in a different light. It is empowering to know why the market reacts the way it does to a single jobs report!
Central Banks: The Invisible Hand Steering the Market
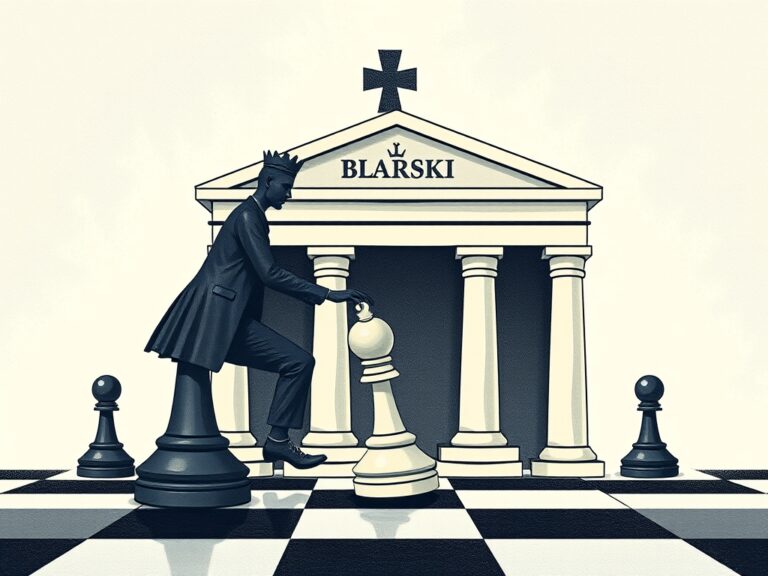
Central banks, like the Federal Reserve in the US, are the ultimate decision-makers when it comes to economic direction. They use monetary policy as their primary tool to manage the balance between growth and stability. When the economy is booming too fast, they might raise interest rates to prevent inflation from spiraling out of control. When things are quiet, they might lower rates to make borrowing cheaper and encourage spending. As an investor, understanding how central banks think is a massive advantage because the market often moves based on their future expectations. You might hear terms like ‘hawkish’ or ‘dovish’ in the news, which simply describe the bank’s stance on these rate adjustments.
- Hawkish: Leaning toward raising rates to combat inflation.
- Dovish: Leaning toward lowering rates to stimulate the economy.
Following the Federal Reserve’s meeting minutes can feel like reading a secret playbook for market participants. Remember, the market hates uncertainty; when central banks communicate clearly, volatility often decreases. It is all about the delicate dance of supply, demand, and the cost of money. By watching these policy moves, you can anticipate how different sectors—like real estate or tech—might behave in the coming months. Stay tuned to their announcements, as they are often the biggest catalyst for major market shifts!
Putting It All Together: Your Actionable Strategy
Now that you have the vocabulary, how do you actually apply this to your life? Don’t let the economic indicators overwhelm you; instead, build a consistent habit of checking the ‘big picture’ news once a week. Focus on how these trends relate to your long-term goals rather than getting caught up in daily market volatility. Diversification remains your best friend, as it acts as a buffer against unexpected economic shifts. Remember that investing is a marathon, not a sprint, and your ability to stay calm during market fluctuations is a superpower. Keep a simple journal of how your portfolio reacts to major news events to learn your personal risk tolerance. Always ask yourself: ‘Does this news change the fundamentals of my investment, or is it just noise?’ You will find that most headlines are short-lived, while true economic trends take months or years to play out. Embrace the learning process, stay patient, and keep your focus on your long-term financial vision. The more you practice, the more intuitive these concepts will become. You are building a foundation of knowledge that will serve you for years to come. Congratulations on taking this step toward mastering your economic future, one trend at a time!