
Market Trends Simplified: A Plain-English Guide to Economic Indicators and Analysis
Understanding Market Trends: Why They Matter
Have you ever checked the news and felt like the financial reports were written in a foreign language? You aren’t alone, as market trends can seem incredibly intimidating at first glance. Think of economic indicators like the vital signs of a patient; just as a doctor checks blood pressure or pulse, investors check inflation rates, GDP growth, and consumer confidence. When you grasp these core metrics, you move from guessing to making informed decisions about your financial future. This guide is designed to strip away the jargon and provide a plain-English roadmap to understanding the pulse of the economy. By learning how to interpret these signals, you gain a massive advantage in navigating the unpredictable world of investing. Whether you are saving for retirement or just curious about how global events shift your wallet, knowledge is your most valuable asset. Let’s break down these complex indicators into bite-sized, actionable pieces so you can feel confident in your economic literacy. It is not about becoming a Wall Street pro overnight, but rather about developing a gut feeling for how the world moves. Ready to start decoding the trends that drive our global financial system? Let’s dive in together.
Key Indicators You Should Actually Watch
To keep your finger on the pulse of the economy, you really only need to monitor a handful of essential economic indicators. Most experts suggest focusing on these specific data points to understand where the market is headed:
- GDP (Gross Domestic Product): The total value of all goods and services produced, essentially measuring how big the ‘economic pie’ is.
- Inflation (CPI): This tells you how fast prices are rising, which directly affects your purchasing power.
- Unemployment Rate: A high rate suggests a cooling economy, while low numbers often signal a tight, competitive labor market.
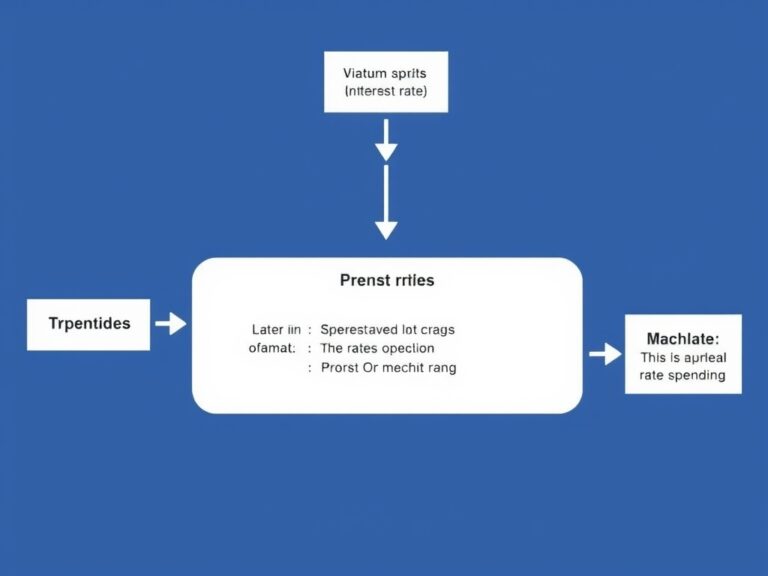
- Interest Rates: Set by central banks, these dictate how expensive it is to borrow money for homes, cars, or business expansion.
Keeping track of these four items will give you a better picture of the economic climate than watching hour-by-hour stock fluctuations. When these indicators move, they create a ripple effect that touches everything from the price of gas to the interest rate on your credit card. Understanding their relationship helps you anticipate market shifts before they dominate the evening news. By simplifying these complex inputs, you transform from a passive observer into an active, informed participant in the market. It is all about connecting the dots between official reports and your daily reality, which is the hallmark of a smart, seasoned investor.
Analyzing the Trends: A Practical Approach
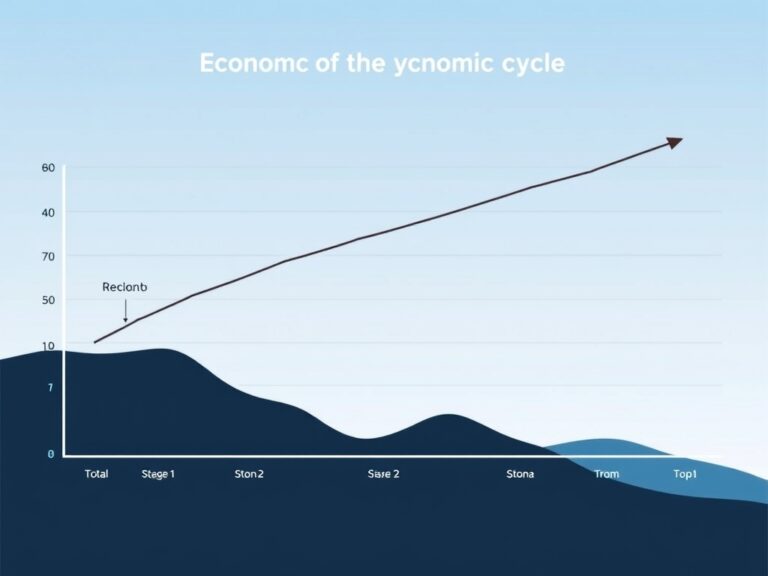
Now that you know what to look for, how do you actually analyze these trends without getting lost in the data? The trick is to look for the ‘Big Picture’ direction rather than obsessing over individual data points or volatile short-term spikes. Market analysis is less about predicting the future with a crystal ball and more about recognizing current cycles, such as expansion, peak, contraction, or trough. When you see inflation rising alongside strong jobs data, you might be looking at a period of rapid economic growth. Conversely, if GDP slows down and unemployment climbs, it is usually a sign that the economy is entering a cooling-off phase. Always look for reliable sources, such as government labor statistics or reputable financial journals, to avoid falling for sensationalist headlines. Remember that markets have a funny way of reacting to expectations, often pricing in ‘bad news’ before it even happens. By staying disciplined and objective, you can strip away the emotional noise that often drives retail investors to make panicked choices. Focus on the trends that persist over months and quarters, not minutes. This steady, grounded approach is exactly how experts build lasting portfolios and manage risk through all types of economic weather.
Putting Your Knowledge Into Action
Mastering these concepts is ultimately about improving your personal financial trajectory and feeling empowered by your choices. You don’t need a degree in economics to see that when interest rates are low, it might be a great time to refinance your home or expand your business. Similarly, knowing that inflation erodes cash value encourages you to explore long-term investment vehicles rather than just letting your savings sit stagnant. Financial literacy is the bridge between hard work and true wealth, and it all starts with the basics we covered today. Take a moment to track these four key indicators for the next month and notice how they impact your personal spending. You will be surprised at how quickly you start ‘seeing’ the economy everywhere you look, from the grocery store checkout to the real estate market. The goal is to make these concepts work for you, serving as a compass in a complex financial world. Continue your journey by staying curious, reading regularly, and never being afraid to ask questions about how the ‘big’ numbers translate to your ‘small’ bank account. You have all the tools you need to stay ahead of the curve and make the market work to your advantage. Your financial future is waiting, and you are officially in the driver’s seat now!