

Decoding the Markets: A Plain-English Guide to Economic Indicators and Trends
Understanding the Financial Pulse: Why Economic Indicators Matter
Have you ever felt like the stock market is speaking a foreign language? You aren’t alone; many investors feel overwhelmed by complex jargon and volatile charts, but decoding the markets is actually easier than you think. At its core, the economy is just a giant feedback loop, and economic indicators are the vital signs that tell us if it’s healthy or struggling. By keeping an eye on these key data points, you can stop guessing and start making informed financial decisions. Whether you are a seasoned trader or a curious beginner, understanding these trends gives you a massive advantage in navigating your portfolio. Think of economic indicators like a weather forecast for your money; they don’t predict the future with 100% certainty, but they give you a better idea of whether to carry an umbrella or enjoy the sunshine. We will break down the most essential signals that drive market movement, stripping away the complexity so you can focus on what actually matters. Let’s embark on this journey to turn market noise into actionable insights for your financial future. Knowledge is power, and once you grasp the basics, you will never look at a headline the same way again.

The Big Three: GDP, Inflation, and Employment
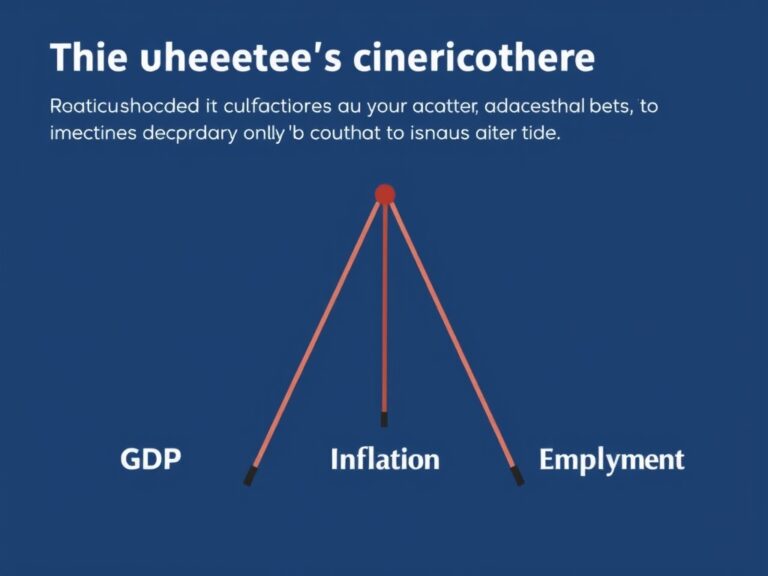
To really understand the engine driving our economy, we have to start with the Big Three indicators that experts watch daily:
- GDP (Gross Domestic Product): This measures the total value of goods and services produced, serving as the ultimate report card for economic health.
- Inflation (CPI/PCE): This tells us how fast prices are rising, which directly impacts your purchasing power and cost of living.
- Employment Data (Non-Farm Payrolls): When people have jobs, they spend money, which keeps the economic cycle turning smoothly.
When GDP grows, it usually suggests a thriving business environment, but if it overheats, inflation often follows closely behind. You can think of inflation as a silent tax that erodes the value of your savings over time if you aren’t invested correctly. Meanwhile, the jobs report is arguably the most watched indicator by the Federal Reserve because it signals labor market tightness. By watching how these three interact, you can effectively anticipate shifts in interest rate policies, which are the primary movers of stock and bond prices. Don’t worry if these numbers sound intimidating; we will simplify them into patterns you can easily spot in your daily news cycle. Keeping these three pillars in mind will provide a solid foundation for every investment decision you make moving forward.
Decoding Market Trends: Leading vs. Lagging Indicators
One of the most important concepts for any investor to learn is the difference between leading and lagging indicators, as this helps you avoid common traps. Leading indicators, like consumer sentiment or stock market performance, act as a crystal ball, signaling where the economy might be headed in the next few months. On the other hand, lagging indicators, such as the unemployment rate, confirm the trends that have already taken place, serving as a reality check for the data. Most people make the mistake of reacting to lagging indicators as if they are fresh news, which causes them to make emotional trades at the worst possible time.
- Leading: Purchasing Managers Index (PMI), Stock Market, Housing Starts.
- Lagging: Unemployment rate, Corporate earnings, Interest rates.
By identifying whether a news report is a ‘heads-up’ or a ‘recap,’ you can position your investments with much greater confidence. For instance, if housing starts are slowing down, it’s a leading indicator that the construction and banking sectors might face headwinds soon. Learning to look forward rather than backward is exactly what separates successful market analysts from the average retail investor. Mastering this distinction ensures that you aren’t just reacting to the past, but actively preparing for the economic environment that is currently taking shape.

Practical Tips for Your Financial Strategy
Now that you have the basic toolkit, how do you actually apply this to your own personal finance strategy without losing your mind? Start by keeping a simple watchlist of these key reports, checking them once a month rather than obsessing over daily fluctuations. Consistency is king, and you will find that the markets often overreact to short-term news, creating buying opportunities for those who understand the big picture. Avoid the urge to act on every single piece of breaking data, as volatility is just a natural part of the market’s process. Instead, focus on the long-term trend lines, as these are much more reliable than any single headline or analyst opinion.
- Step 1: Subscribe to a reliable, jargon-free economic calendar.
- Step 2: Observe how markets respond to data over time.
- Step 3: Adjust your portfolio balance when the trend shifts, not when the price dips.
By keeping a level head and using these indicators as your guide, you remove the guesswork from your investment path. Remember, the goal isn’t to be perfect, but to be consistent, patient, and informed while others are panicking. Take control of your financial destiny by applying these insights and staying ahead of the curve in an ever-changing economic landscape. You have the tools, you have the knowledge, and now you are ready to decode the market with confidence and clarity!