

Making Sense of the Markets: Economic Indicators Explained in Plain English
Understanding the Pulse of the Global Economy
Have you ever watched the financial news and felt like they were speaking a completely different language? You aren’t alone; the world of economic indicators can feel like a maze of jargon designed to confuse the average investor. However, think of these indicators as the vital signs of our economy, much like a doctor checks your blood pressure or heart rate to see how you are doing. By learning to decode these signals, you can move from feeling overwhelmed to making informed, confident decisions about your personal finances. We will break down how these data points—from unemployment numbers to retail sales—actually influence the market trends you see daily. When you understand the engine under the hood, it becomes much easier to navigate the occasional bumps in the road. Let’s demystify these metrics together, ensuring you have the tools to grasp what’s really happening in the financial landscape. It’s not just about charts and numbers; it’s about understanding the human behavior that drives these economic cycles. Whether you are a seasoned trader or a curious beginner, gaining clarity here is your best strategy for long-term success. Stick with me, and we will turn that confusion into a competitive advantage.
The Big Three: GDP, Inflation, and Employment
When investors talk about the health of the economy, they usually focus on a specific ‘Big Three’ set of reports that act as the backbone of market analysis. First, we have Gross Domestic Product (GDP), which is essentially the total value of all goods and services produced; think of it as the economy’s report card. Second, there is inflation, often measured by the Consumer Price Index (CPI), which tracks how much your dollar is losing (or keeping) its purchasing power over time. Third, the unemployment rate tells us how many people are active in the workforce and earning a living, which directly impacts consumer spending. Why do these matter?
- GDP growth signals corporate expansion and potential stock market gains.
- High inflation can trigger central banks to raise interest rates, which often cools off investment growth.
- Low unemployment usually means more money is circulating in the economy, boosting retail performance.
Keeping an eye on these three gives you a snapshot of whether the economy is heating up, cooling down, or hitting a stall. It’s like checking the weather before you plan a trip; you wouldn’t head to the beach in a storm, and you shouldn’t ignore these trends before making big financial moves.
Why Sentiment and Retail Data Matter
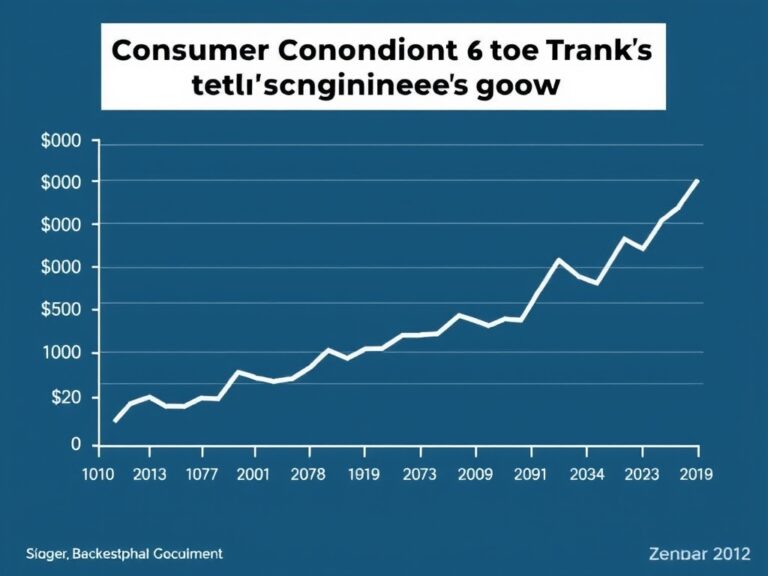
Beyond the heavy-hitting macroeconomic numbers, there are leading indicators that offer a glimpse into the future rather than just reporting the past. Retail Sales data is a fantastic example because it tracks how much people are spending at stores and online; since consumption drives a huge chunk of our economy, this is a major hint at where we are headed. Then, you have the Consumer Confidence Index, which captures how people feel about their own financial future; when people feel safe, they spend, and when they are nervous, they save. These indicators are often called ‘soft data’ because they rely on surveys and trends rather than just hard cash flows. If you see consumer confidence dipping, you might expect a slowdown in the housing or automotive sectors shortly thereafter. It’s about understanding the ‘vibe’ of the market—when consumers are optimistic, businesses invest, and the cycle of growth continues. Pay attention to these reports, as they can often act as an early warning system for shifts in market sentiment. By watching how people behave today, you can better predict the market shifts of tomorrow.
Making Sense of the Noise
It is easy to get caught up in the constant stream of updates, but the real trick is separating signal from noise. Markets are volatile, and a single bad report might lead to a sharp, knee-jerk reaction that doesn’t actually reflect the long-term reality of the economy. Instead of reacting to every single headline, try to look at the bigger picture and how these economic indicators work together in tandem. Remember that no single metric can tell the whole story; it is the combination of employment, spending, and production that gives you a complete view. If you feel overwhelmed, create a checklist of the indicators you want to watch each month rather than trying to track every fluctuation in real-time. Developing this disciplined approach will help you stay focused on your long-term goals despite the daily market chatter. Take control of your financial education by staying curious, reading reliable sources, and always asking *why* a number moved the way it did. Armed with this knowledge, you are far better equipped to manage your investments with wisdom and patience. Knowledge is the ultimate hedge against market uncertainty, so keep learning and stay engaged with these fundamental economic concepts.