Market Movements Explained: A Plain-English Guide to Economic Indicators
Have you ever stared at a stock chart and wondered what on earth causes those sudden, dramatic swings? 📈 Well, you’re not alone, because understanding market movements can often feel like trying to read a foreign language without a dictionary. In reality, the financial markets react to a constant stream of data known as economic indicators, which act like the pulse of a nation’s financial health. Think of these indicators as a dashboard in a car; they tell us how fast we are going, whether we are running out of gas, or if the engine is overheating. When major reports are released, investors and traders analyze the data to predict future trends, which immediately influences buying and selling behavior. By learning how to decode these signals, you can transition from a confused spectator to an informed participant who understands the underlying forces driving asset prices. Today, we are going to break down the most critical economic indicators in a plain-English guide that demystifies the entire process. We will look at how gross domestic product (GDP), inflation, employment figures, and central bank decisions shape the financial landscape. Armed with this knowledge, you will be able to navigate market volatility with far greater confidence and clarity. Let’s embark on this financial journey together and uncover the secrets behind those green and red market charts.

🦁 The King of Indicators: Gross Domestic Product (GDP)
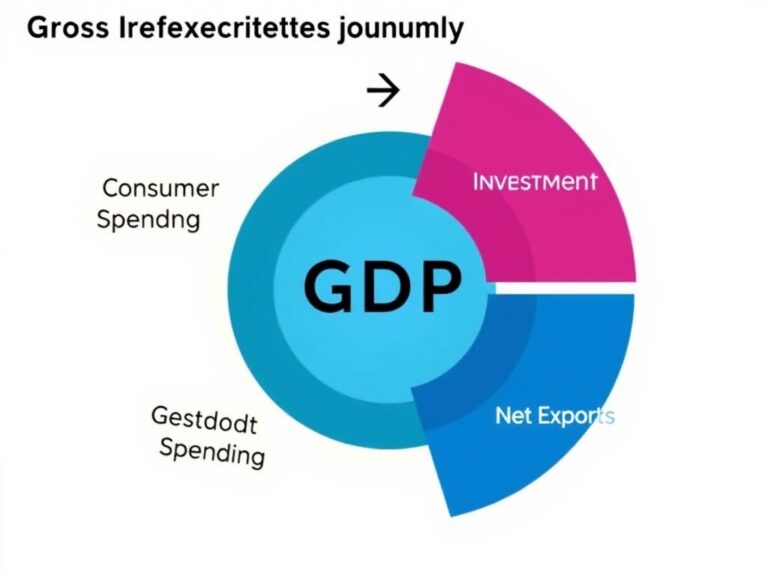
To truly grasp how the economy is performing, we must start with the heavyweight champion of economic data: Gross Domestic Product, or GDP. In simple terms, GDP represents the total monetary value of all goods and services produced within a country’s borders over a specific timeframe, usually a quarter or a year. It serves as the ultimate scorecard for a nation’s economic vitality, showing whether the economy is expanding or contracting. When GDP growth is robust, businesses thrive, hiring increases, and consumer confidence rises, which generally fuels a bullish stock market. Conversely, when GDP shrinks for two consecutive quarters, it signals a technical recession, causing investors to panic and stock prices to tumble. This powerful number is typically driven by four major engines, which include consumer spending, business investment, government expenditures, and net exports.
- Consumer Spending: This represents the money everyday citizens spend on goods and services.
- Business Investment: This covers capital spent by corporations on expansion and equipment.
- Government Spending: This represents public outlays on infrastructure and defense.
- Net Exports: This calculates exports minus imports.
Understanding this breakdown is crucial because a sudden drop in consumer spending can drag the entire GDP down, sending shockwaves through the market. Investors watch GDP revisions closely because even minor adjustments can trigger major shifts in asset allocation. Ultimately, keeping an eye on GDP trends allows you to align your investment portfolio with the broader macroeconomic cycle.
🔥 Inflation and the CPI: Why Your Money Buys Less
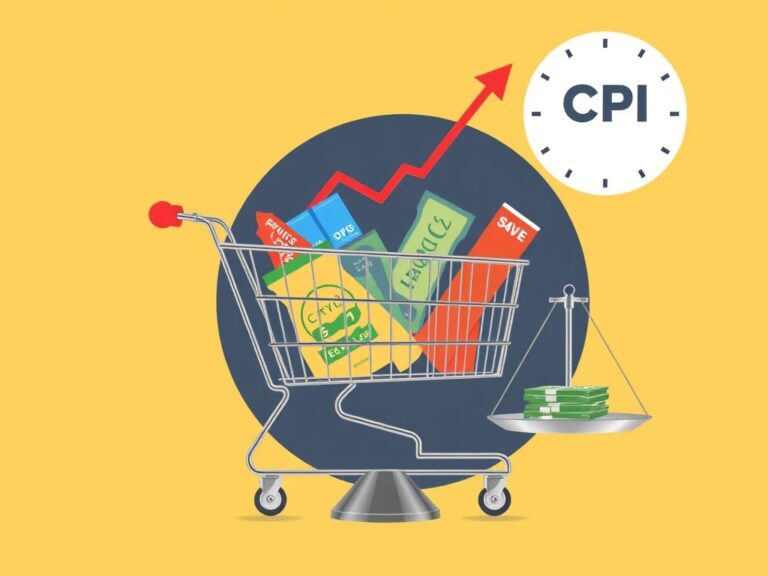
If GDP is the engine of the economy, then inflation is the heat that can either keep it warm or burn it to the ground. Inflation measures the rate at which the general level of prices for goods and services is rising, effectively eroding your purchasing power over time. The primary tool used to measure this phenomenon is the Consumer Price Index (CPI), which tracks the average change in prices paid by consumers for a basket of goods. When inflation is low and stable, the economy grows at a sustainable, healthy pace. However, when CPI spikes unexpectedly, it means inflation is rising too fast, forcing companies to pay more for raw materials and consumers to pay more at the grocery store. This scenario often leads to reduced corporate profits and lower consumer spending, which can cause stock markets to decline. Investors dread high inflation because it forces central banks to intervene by raising interest rates, which dampens economic activity. To protect your wealth, you must understand how CPI reports affect your purchasing decisions and your investment portfolio. Let’s summarize how different inflation environments impact assets:
- Moderate Inflation: This is generally positive for equities as it reflects a growing economy.
- High Inflation: This hurts bonds and growth stocks while favoring commodities and real estate.
- Deflation: This refers to falling prices, which can stall economic growth as consumers delay purchases.
By keeping a close eye on monthly CPI releases, you can anticipate shifts in monetary policy and adjust your investment strategy accordingly.
🏦 Central Banks and Interest Rates: Taming the Economic Beast
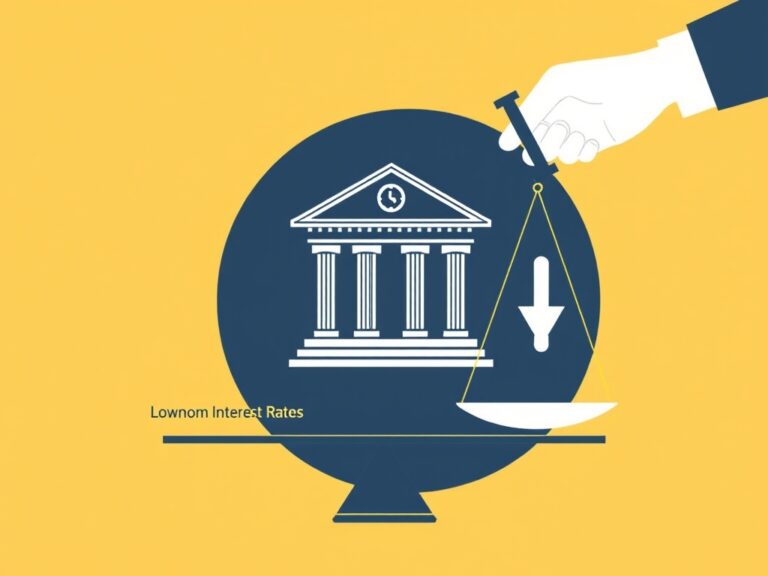
Now that we understand growth and inflation, we must examine the ultimate economic lever: interest rates, controlled by central banks like the Federal Reserve. Central banks use interest rates as a steering wheel to either accelerate or brake the national economy. When the economy is sluggish, central banks lower rates to make borrowing cheaper, encouraging businesses to expand and consumers to take out loans for homes and cars. This influx of cheap money acts as a powerful stimulant, driving stock market movements upward as corporate earnings rise. On the flips side, if inflation burns too hot, central banks will raise interest rates to cool down spending and borrowing. Higher interest rates make loans more expensive, which slows down corporate growth and makes bonds look more attractive relative to stocks. Consequently, rate hikes often lead to temporary market downturns, as investors adjust to the higher cost of capital. You can think of interest rate adjustments as a balancing act with three main outcomes:
- Rate Cuts: These stimulate growth, boost stock prices, and lower the yield on savings accounts.
- Rate Hikes: These fight inflation, depress stock valuations, and increase yields on fixed-income assets.
- Hold Decisions: These offer stability, indicating that the central bank is waiting for more data.
As an investor, tracking central bank meetings and monetary policy statements is absolutely essential for anticipating major market rotations. Understanding these policy shifts helps you position your portfolio ahead of changing interest rate environments.
💼 Employment Figures: The Fuel That Powers the Economic Engine
The final piece of our economic puzzle is labor, which is primarily measured through the unemployment rate and job creation reports. A healthy job market is the very foundation of consumer confidence because employed citizens have steady wages to spend back into the economy. When employment figures are strong—such as the monthly Non-Farm Payrolls (NFP) report in the United States—it indicates a robust and growing economy. However, a labor market that is too tight can lead to wage inflation, forcing companies to raise prices to cover higher payroll costs. This creates a complex feedback loop where strong job growth can sometimes cause the stock market to drop out of fear that the central bank will raise interest rates to curb inflation. On the other hand, high unemployment is a clear sign of economic distress, resulting in reduced consumer spending, declining corporate earnings, and bearish markets. Understanding this delicate balance helps you interpret why good news in employment reports can sometimes lead to negative market movements. Let’s look at key labor metrics to monitor:
- Unemployment Rate: The percentage of the labor force that is jobless and actively seeking work.
- Job Openings (JOLTS): A measure of labor demand, showing how many open positions employers are trying to fill.
- Wage Growth: The rate at which average hourly earnings are increasing, indicating inflationary pressure.
By monitoring labor market indicators, you gain a clearer picture of consumer spending capacity and future monetary policies. This insight allows you to make smarter, data-driven investment decisions that align with the true state of the workforce.